

The strongest public evidence for AI autonomous driving safety does not come from a dashboard, a product launch, or a selectively framed miles-driven claim. It comes from a peer-reviewed Waymo analysis by Kusano and colleagues, published in 2025, comparing 56.7 million rider-only autonomous miles against a spatially dynamic human-driver benchmark. In its most favorable reading, the result is substantial: an 85% reduction in suspected serious injury-or-worse crashes, with a 95% confidence interval from 39% to 99%; a 79% reduction in any-injury-reported crashes; and a 96% reduction in vehicle-to-vehicle intersection injury crashes.[1]
That is not a trivial paper. It is larger than the usual AV safety anecdote, more explicit than the usual manufacturer safety page, and more clinically recognizable than most public arguments about autonomy. It specifies the operating exposure, uses a comparator rather than raw crash counts alone, and disaggregates crash types instead of collapsing everything into one reassuring average.[1]
The question is whether this evidence supports the popular claim that autonomous vehicles are now safer than human drivers in general. That is a different claim from saying that one autonomous driving system, in certain deployed conditions, appears to have materially lower rates for some injury crash categories than a modeled human benchmark.
What the Waymo study earns credit for
The Waymo paper matters because it tries to answer the right comparative question. Autonomous-vehicle safety cannot be judged simply by counting reported crashes. A fleet operating in dense urban areas, at particular times of day, under specific weather conditions, and within carefully mapped service territories is not exposed to the same risk mix as all human driving. A meaningful comparison has to account for where the vehicle was operating and what kind of human-driving risk would be expected there.
Kusano et al. addressed that with a spatial dynamic benchmark methodology. The study compared Waymo’s rider-only autonomous driving system against human-driver crash expectations matched to operational exposure, then reported results by injury severity and crash type. The 56.7 million rider-only miles are important because they represent driverless commercial-style operation, not supervised testing miles with a safety driver waiting behind the wheel.[1]
The intersection result deserves particular attention. Intersections are a clinically familiar kind of safety problem: high consequence, recurrent, mechanistically plausible, and amenable to targeted system improvement. A reported 96% reduction in vehicle-to-vehicle intersection injury crashes is more informative than a generic “safer than humans” line because it identifies a crash family where the system may have a specific advantage.[1]
This is the kind of evidence that should make governance committees pause before dismissing AV safety claims as mere optimism. The study is not proof of universal superiority, but it is evidence of meaningful safety promise.
The 85% result is large; the event base is small
The load-bearing limitation sits inside the headline result. The 85% reduction in suspected serious injury-or-worse crashes rests on only 2 ADS-involved events, both secondary crashes. The confidence interval is correspondingly wide: 39% to 99%, with p=0.04.[1]
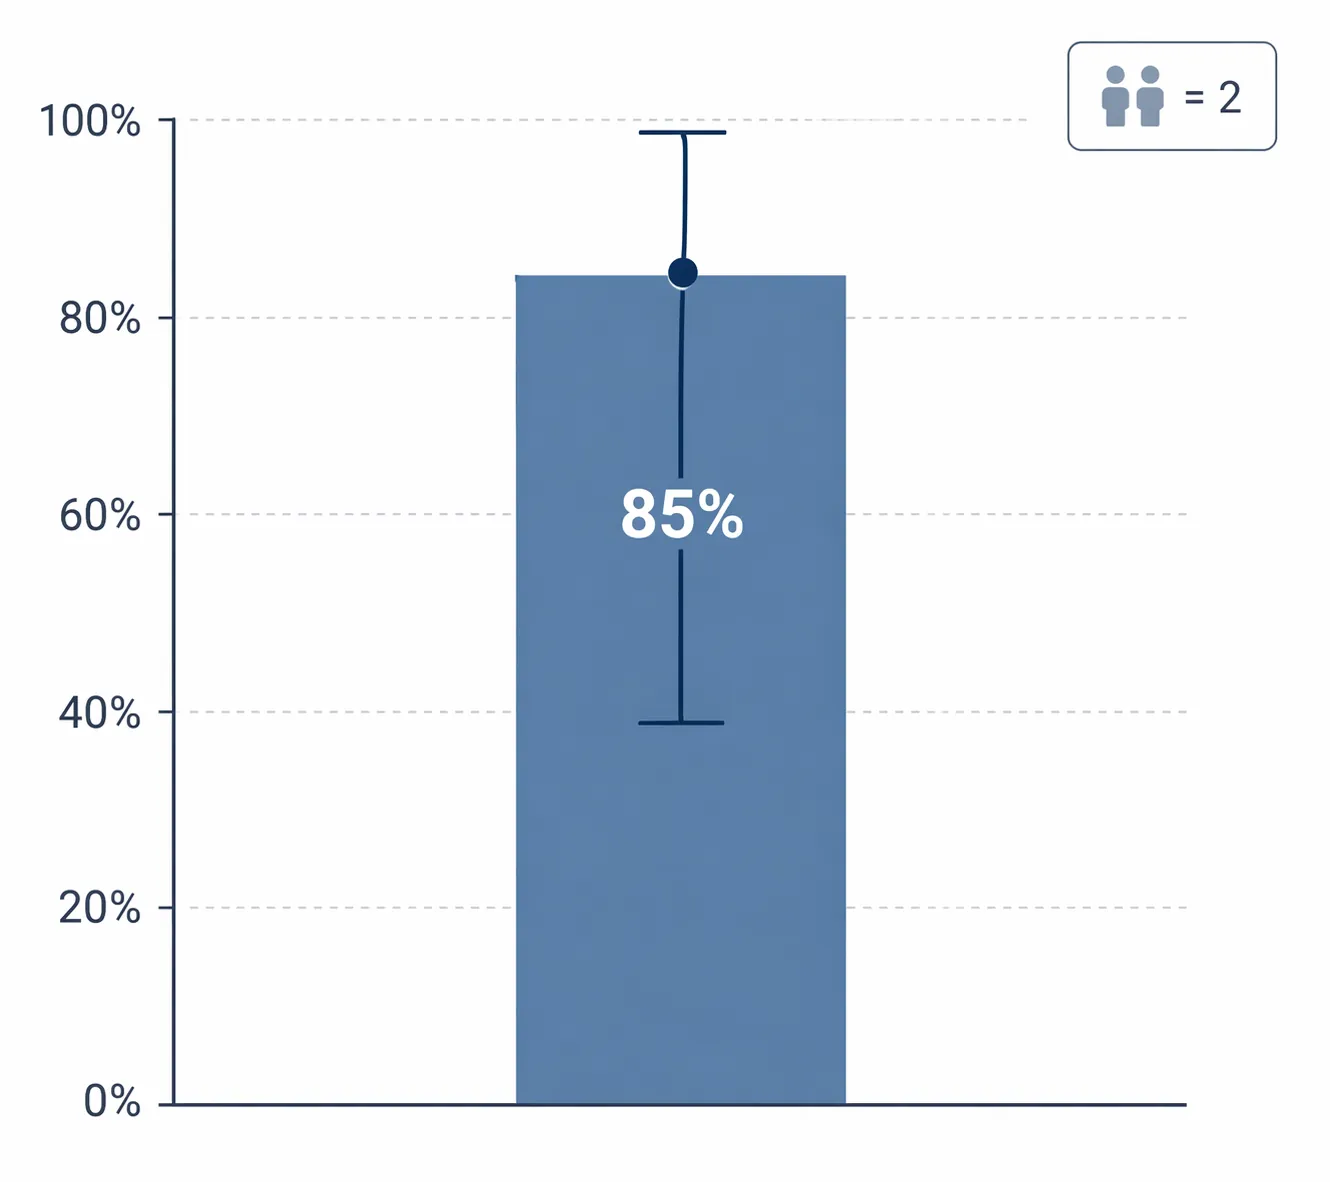
A clinical-AI reviewer would not ignore the direction of effect. But neither would they treat the point estimate as if it were a stable property of the technology. Two events can support an important signal; they cannot carry the rhetorical weight of a settled general safety verdict.
The wide interval is not a cosmetic statistical detail. It tells the decision-maker how much uncertainty remains around the magnitude of the effect. A 39% reduction and a 99% reduction would imply very different levels of confidence for procurement, expansion, insurance pricing, public communication, and regulatory posture. Both sit inside the reported interval.[1]
The authorship also matters. Every author on the Waymo paper works for Waymo.[1] That does not invalidate the study. Industry-sponsored evidence can be rigorous, and in safety-critical technology it is often the manufacturer that has the best access to operational data. But the correct evidentiary category is closer to a well-conducted industry-authored clinical validation study than to independent post-market surveillance. It is readable, useful, and serious; it still needs independent replication before the claim hardens into a general conclusion.
The distinction matters because the public claim usually loses its qualifiers first. “An autonomous fleet showed lower injury crash rates than a matched human benchmark across 56.7 million rider-only miles” becomes “AVs are safer than human drivers.” The first sentence is evidence. The second is a much broader policy and deployment claim.
Why the federal crash database cannot rescue the general claim
After the Waymo paper, the natural place to look is the National Highway Traffic Safety Administration’s Standing General Order crash-reporting database. It is tempting because it is federal, large, and public. Through November 2025, the database listed 5,202 ADS-involved incidents, including 65 fatalities and 209 serious injuries. The state distribution was also uneven: 2,619 incidents in California, 505 in Arizona, and 94 in Texas.[2]
Those counts are important for surveillance. They are not enough for benchmarking. NHTSA explicitly states that the SGO data “are not normalized” and “should not be assumed to be statistically representative.”[2] That warning should stop any denominator-ready comparison across companies, vehicle types, geography, or human-driver baselines unless the missing exposure and reporting context have been supplied elsewhere.
This is a familiar evidence trap. A large registry can look more authoritative than a smaller controlled analysis, but size does not repair non-representativeness. If reporting intensity varies by manufacturer, jurisdiction, operating domain, crash severity, or public visibility, the numerator can become a record of both safety events and reporting mechanics.
| Evidence source | What it can support | What it cannot support by itself |
|---|---|---|
| Waymo Kusano et al. 2025 | A peer-reviewed finding of lower injury crash rates for Waymo rider-only operations under the study’s benchmark method, including strong intersection-crash findings.[1] | A general conclusion that all AVs are safer than human drivers across operating domains, manufacturers, and severe-outcome categories. |
| NHTSA SGO crash reports | Public surveillance of reported ADS-involved incidents, fatalities, serious injuries, and reporting geography.[2] | Normalized cross-manufacturer safety comparisons or statistically representative crash-rate estimates.[2] |
| Vendor safety statistics | Potentially useful operational monitoring when methods and exposure are transparent. | Independent proof of superiority if denominators, comparators, and analytic access are not auditable. |
For a governance reader, the practical consequence is straightforward: the SGO database is useful for asking what has been reported and where the reporting burden is visible. It is not a substitute for normalized exposure data. It cannot tell a hospital-style AI committee, regulator, insurer, or city official that one AV system is statistically safer than another, or that AVs as a class outperform humans.
Fatality superiority is a harder statistical problem
The rarest outcomes are usually the ones the public cares about most. Fatal crashes are also the hardest outcomes to use for timely statistical proof, because they occur infrequently relative to miles driven. That is why the RAND 2015 statistical power analysis remains relevant. It found that hundreds of millions of miles would be needed to demonstrate fatality-rate equivalence or superiority with adequate statistical power.[3]
The RAND analysis is not a perfect 2026 instrument. It reflected the assumptions and AV maturity of its time, and current systems may have different risk profiles. An updated power analysis could change the exact thresholds. But the basic warning survives: a visually large operating-mile number is not automatically large enough for fatality-rate inference.
This is where AV evidence starts to resemble the clinical-AI evidence gap discussed in Why Most Medical AI Studies Never Reach Clinical Trials. A model can perform convincingly in one validation frame and still leave the decision-maker without enough power, independence, or post-deployment breadth to support a broad safety claim.
Marketing statistics belong in a lower evidentiary tier
Tesla FSD is the contrast case because it shows how quickly safety statistics can become promotional evidence. A manufacturer can report miles between crashes, compare against a broad human baseline, or emphasize driver-assistance performance, yet still leave unresolved questions about exposure mix, disengagement, driver supervision, event definitions, and independent access to the underlying data.
That does not mean vendor data are useless. In both autonomous driving and clinical AI, the developer often sees early signals before anyone else does. But when the claim is safety superiority, the evidentiary standard has to move beyond product telemetry. The denominator must be auditable. The comparator must be justified. The event definitions must be stable. The analysis must be reproducible by parties who do not benefit from the result.
Liability-claims evidence, including Swiss Re’s work on AV claim frequency, belongs in a secondary category. It can corroborate a favorable risk signal, especially for insurance-relevant outcomes. It does not replace crash-rate evidence, injury-severity analysis, or fatality-rate power. A liability claim is not the same unit of evidence as a crash, an injury, or an independently adjudicated safety endpoint.
Standards activity is not the same as empirical proof
The standards landscape adds process reassurance but not final empirical proof. Ullrich and colleagues’ survey of AI safety standardization found 102 AI safety standards work-in-progress and no convergence.[4] That is a sign of intense activity, not settled evidence that autonomous systems are generally safer in deployment.
This distinction is especially important for readers coming from health AI. A safety standard can improve development discipline, documentation, hazard analysis, and lifecycle management. It can make weak systems harder to ship carelessly. It cannot, by itself, demonstrate that a deployed AI system reduces severe outcomes compared with the relevant human baseline.
The regulatory setting also differs. Autonomous driving sits under transportation authorities such as NHTSA, not FDA-style medical-device review. The analogy here is methodological rather than jurisdictional. The same appraisal habits still apply: define the claim, inspect the comparator, check the event count, identify conflicts, and ask whether the evidence is powered for the outcome that matters.
A disciplined evidence verdict
The best peer-reviewed evidence supports a meaningful safety promise for autonomous driving, particularly for Waymo’s rider-only operations and for certain injury crash types such as vehicle-to-vehicle intersection crashes. It does not yet support a broad, unqualified conclusion that AVs are safer than human drivers at the confidence level ClinicalMind readers would usually expect for safety-critical AI.
| Question for appraisal | Current answer |
|---|---|
| Is there serious peer-reviewed evidence of AV safety benefit? | Yes. The Waymo 2025 study is methodologically explicit, large in rider-only miles, and reports substantial reductions in injury crash categories.[1] |
| Is the headline serious-injury result statistically robust? | Promising but fragile. The 85% estimate rests on only 2 ADS-involved serious injury-or-worse events, with a 95% confidence interval from 39% to 99%.[1] |
| Is the strongest study independent? | No. All authors are Waymo employees, making independent replication essential before general safety claims harden.[1] |
| Can the NHTSA SGO database be used for normalized benchmarking? | No. NHTSA states the data are not normalized and should not be assumed statistically representative.[2] |
| Has fatality-rate superiority been adequately powered in published peer-reviewed evidence? | Not in the evidence set reviewed here. The RAND analysis explains why hundreds of millions of miles remain a relevant statistical warning for fatality comparisons.[3] |
| Do standards efforts close the empirical gap? | No. Standards activity can improve process discipline, but it does not substitute for normalized, independent, adequately powered outcome evidence.[4] |
The right question is not whether autonomous driving is impressive. It is which safety claim has enough independent, normalized, adequately powered evidence to be treated as proven.
References
- Comparison of Waymo Rider-Only Crash Data to Human Benchmarks at 56.7 Million Miles, Traffic Injury Prevention, 2025.
- Standing General Order Crash Reporting, National Highway Traffic Safety Administration.
- The Evolving Safety and Policy Challenges of Self-Driving Cars, Brookings.
- Survey of AI Safety Standards, arXiv, 2024.