
The familiar survival headline is true, but it is too blunt for decisions about pancreatic cancer mortality. SEER currently reports a 13.7% five-year relative survival rate for pancreatic cancer based on 2016–2022 data from SEER 21 registries.[1] The American Cancer Society’s 2026 statistics likewise describe a roughly threefold rise in five-year survival, from 4% in the mid-1990s to 13% for patients diagnosed during 2015–2021.[2] Those numbers are often where the progress story begins.
They should not be where an evidence review stops. The same ACS discussion warns that part of this apparent survival gain reflects increased detection of well-differentiated pancreatic neuroendocrine tumors, which are generally much less aggressive than pancreatic ductal adenocarcinoma, or PDAC.[2] That caveat changes the room. A survival denominator that includes more indolent tumors can improve even if the common lethal disease has not become substantially less lethal.

Survival improved; the denominator changed
Pancreatic cancer is not a single biological problem wearing one registry label. A broad “pancreatic cancer” survival statistic combines tumor types with very different natural histories. Well-differentiated neuroendocrine tumors can be found incidentally, grow more slowly, and carry substantially better outcomes than PDAC. ACS attributes part of the threefold survival increase to greater detection of these tumors, rather than to uniform improvement across pancreatic cancer biology.[2]
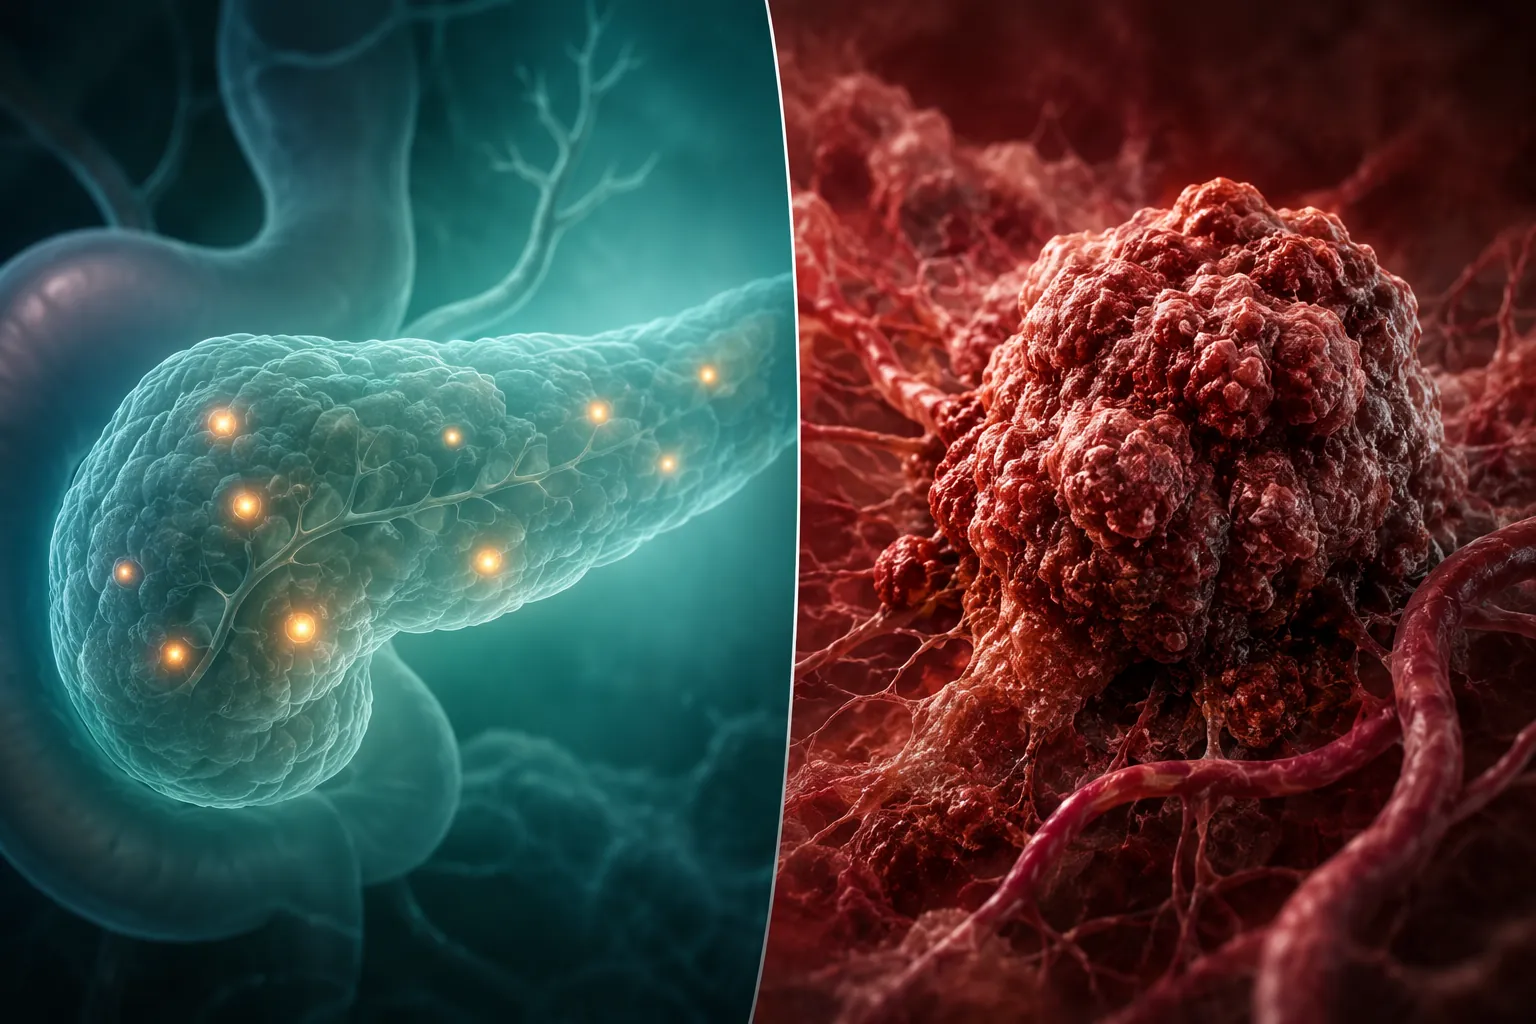
That distinction matters for any committee evaluating a mortality claim. A vendor, program, or policy can truthfully cite a 13% survival figure and still leave unanswered whether patients with PDAC are living longer. PanCAN, summarizing ACS-related figures, has described PDAC-specific five-year survival as approximately 8%, while the better-prognosis neuroendocrine group is much higher.[3] Because that PDAC-specific figure is not the main endpoint in the SEER Cancer Stat Facts page, it should be treated as a narrower disease-specific estimate rather than as a replacement for the registry-wide number.
| Statistic | What it can support | What it cannot support by itself |
|---|---|---|
| 13.7% five-year relative survival in SEER 21, 2016–2022[1] | Pancreatic cancer survival, as broadly registered, remains poor but has improved from older periods. | PDAC mortality is falling. |
| ACS threefold survival increase from 4% to 13%[2] | The broad survival headline is not invented. | The improvement is entirely due to better outcomes for aggressive pancreatic adenocarcinoma. |
| Increased detection of well-differentiated neuroendocrine tumors[2] | Case mix has changed in a way that can inflate apparent survival progress. | Neuroendocrine tumor detection explains every survival gain. |
| PDAC-specific survival estimated around 8% in a PanCAN summary[3] | The common lethal form appears to have a much lower survival profile than the broad pancreatic cancer headline. | A fully independent registry reanalysis has been supplied in that press release. |
This is the first separation procurement reviewers need: survival is not mortality, pancreatic cancer is not synonymous with PDAC, and a broader case mix can make survival look better without proving that fewer people are dying from the disease that accounts for most clinical urgency.
The mortality trend is less encouraging
The most direct population-level test is mortality. Tan and colleagues analyzed pancreatic cancer deaths in CDC WONDER from 1999 through 2020, covering 809,197 deaths in the United States.[4] In that dataset, the age-adjusted mortality rate rose from 20.74 deaths per 100,000 in 1999 to 21.60 per 100,000 in 2020, with an average annual percent change of +0.23%.[4]
That is not a dramatic annual increase, but it points in the wrong direction for a disease whose survival headline is frequently used as shorthand for progress. If survival improves while mortality does not decline, the explanation may include earlier diagnosis, longer measured time from diagnosis to death, changing case mix, treatment gains in selected groups, or some combination of these. The mortality statistic does not explain the mechanism. It does, however, prevent the broad survival number from being treated as proof of population-level mortality improvement.
The disparity pattern in the same CDC WONDER analysis also matters because an average mortality rate can hide the patients most exposed to the disease burden. Tan et al. reported higher age-adjusted mortality among males than females, 23.39 versus 18.51 deaths per 100,000.[4] Non-Hispanic Black males had an age-adjusted mortality rate of 30.11 per 100,000, described as 63% higher than the rate among non-Hispanic White females.[4] The Northeast had the highest regional age-adjusted mortality rate at 22.07 per 100,000.[4]
Rurality adds another layer. Tan et al. reported an age-adjusted mortality rate of 21.29 per 100,000 in rural populations and found that rural mortality increased faster over the study period, with an average annual percent change of +0.63% compared with +0.15% in urban populations.[4] For an early-detection program, these are not decorative subgroup details. They are the populations in which access, imaging pathways, referral timing, and follow-up capacity may determine whether a detection signal ever becomes a mortality effect.
There is a temporal nuance worth keeping. The CDC WONDER analysis ends in 2020. ACS Cancer Statistics 2026 reports 67,530 projected new pancreatic cancer cases and 52,740 projected deaths in 2026, and its longer trend discussion suggests that after decades of slow increase, pancreatic cancer death rates may have stabilized in the most recent years available through 2023.[2] That does not rescue the 13% survival headline as a mortality endpoint. It narrows the claim: the best reading is not that mortality rises forever, but that the broad survival improvement has not yet translated into a demonstrated PDAC mortality decline.
Stage shift is necessary, but it is not the outcome
Early detection has a plausible route to benefit in pancreatic cancer because stage at diagnosis is so strongly tied to survival. Rahib and colleagues examined factors driving pancreatic cancer survival and showed why the location of improvement matters.[5] Localized disease survival doubled from 24% to 46%, but only 14% of patients were diagnosed at the localized stage.[5] Distant-stage disease remained common and contributed very little to overall five-year survival improvement: the authors estimated that distant disease accounted for only 1.4 percentage points of the 12% overall five-year survival improvement.[5]
That is the clinical logic behind screening and early-detection interest. If more patients could be found while disease is localized, the survival curve could move. Rahib et al. modeled that shifting localized diagnosis from 13% to 70% could raise overall five-year survival from 12% to 34%.[5] But a model of what could happen after a large stage redistribution is not evidence that any current detection tool has produced that redistribution, much less reduced mortality.
The distinction is not academic. Stage shift can be real and still overstate patient benefit if earlier labeling mainly adds lead time, if detected lesions include more indolent biology, if treatment access does not follow detection, or if the additional localized cases are not the cases that would otherwise have become lethal PDAC. A credible early-detection claim has to connect the chain: who is detected earlier, what tumor type is detected, whether treatment changes, whether harms and false positives are tolerable, and whether deaths decline in the population being tested.
What this baseline means for AI detection claims
AI systems for pancreatic cancer detection should be evaluated against this mortality baseline, not against the emotional force of the disease alone. A model that finds visually occult cancer earlier may be valuable. It may also be evaluated prematurely if the claim jumps from sensitivity to lives saved.
REDMOD is a useful example because the diagnostic signal is substantial while the outcome question remains open. Mukherjee and colleagues reported that REDMOD achieved 73.0% sensitivity for visually occult pancreatic cancer detection at a median lead time of 475 days, compared with 38.9% sensitivity for radiologists in the study context.[6] Those are diagnostic-performance findings. They do not show that REDMOD reduces PDAC mortality, and the study had not yet supplied racial or ethnic subgroup analysis.[6]
For an AI governance committee, the appraisal standard should therefore stay deliberately higher than “the model sees earlier.” The relevant questions are whether performance replicates outside the development setting, whether sensitivity and false-positive burden hold across subgroups, whether detected cases are PDAC or a broader mix of pancreatic lesions, whether prospective workflows actually move patients to timely diagnosis and treatment, and whether downstream survival or mortality improves without unacceptable harm.
The deeper technical comparison belongs in a tool-focused review such as What the evidence says about AI pancreatic cancer detection on CT. The mortality appraisal here sets the floor: a pancreatic cancer AI claim is not outcome evidence until it shows a credible path from earlier detection to fewer PDAC deaths.
References
- Cancer Stat Facts: Pancreatic Cancer. SEER.
- Cancer Statistics, 2026. CA: A Cancer Journal for Clinicians, 2026.
- Pancreatic Cancer Diagnoses and Mortality Rates Climb; Five-Year Survival Rate for Pancreatic Cancer Stalls at 13%. PanCAN, Jan. 2025.
- Pancreatic Cancer Mortality Trends in the United States. Journal of Gastrointestinal Oncology, 2024.
- Factors Driving Pancreatic Cancer Survival Rates. Pancreas, 2025.
- Next-generation AI for visually occult pancreatic cancer detection. Gut, 2026.