
An air quality forecast becomes clinically useful only when it arrives before the pediatric emergency department fills. A same-day warning that PM10 and ozone are likely to rise is interesting; a daily risk estimate that helps a charge nurse open beds, a pediatric ED physician prepare bronchodilator capacity, or a public health team send targeted reminders to families with vulnerable children is different. That is the narrow but important promise of AI in air quality forecasting and health protection: not just predicting the atmosphere, but giving health systems enough notice to act before respiratory demand climbs.
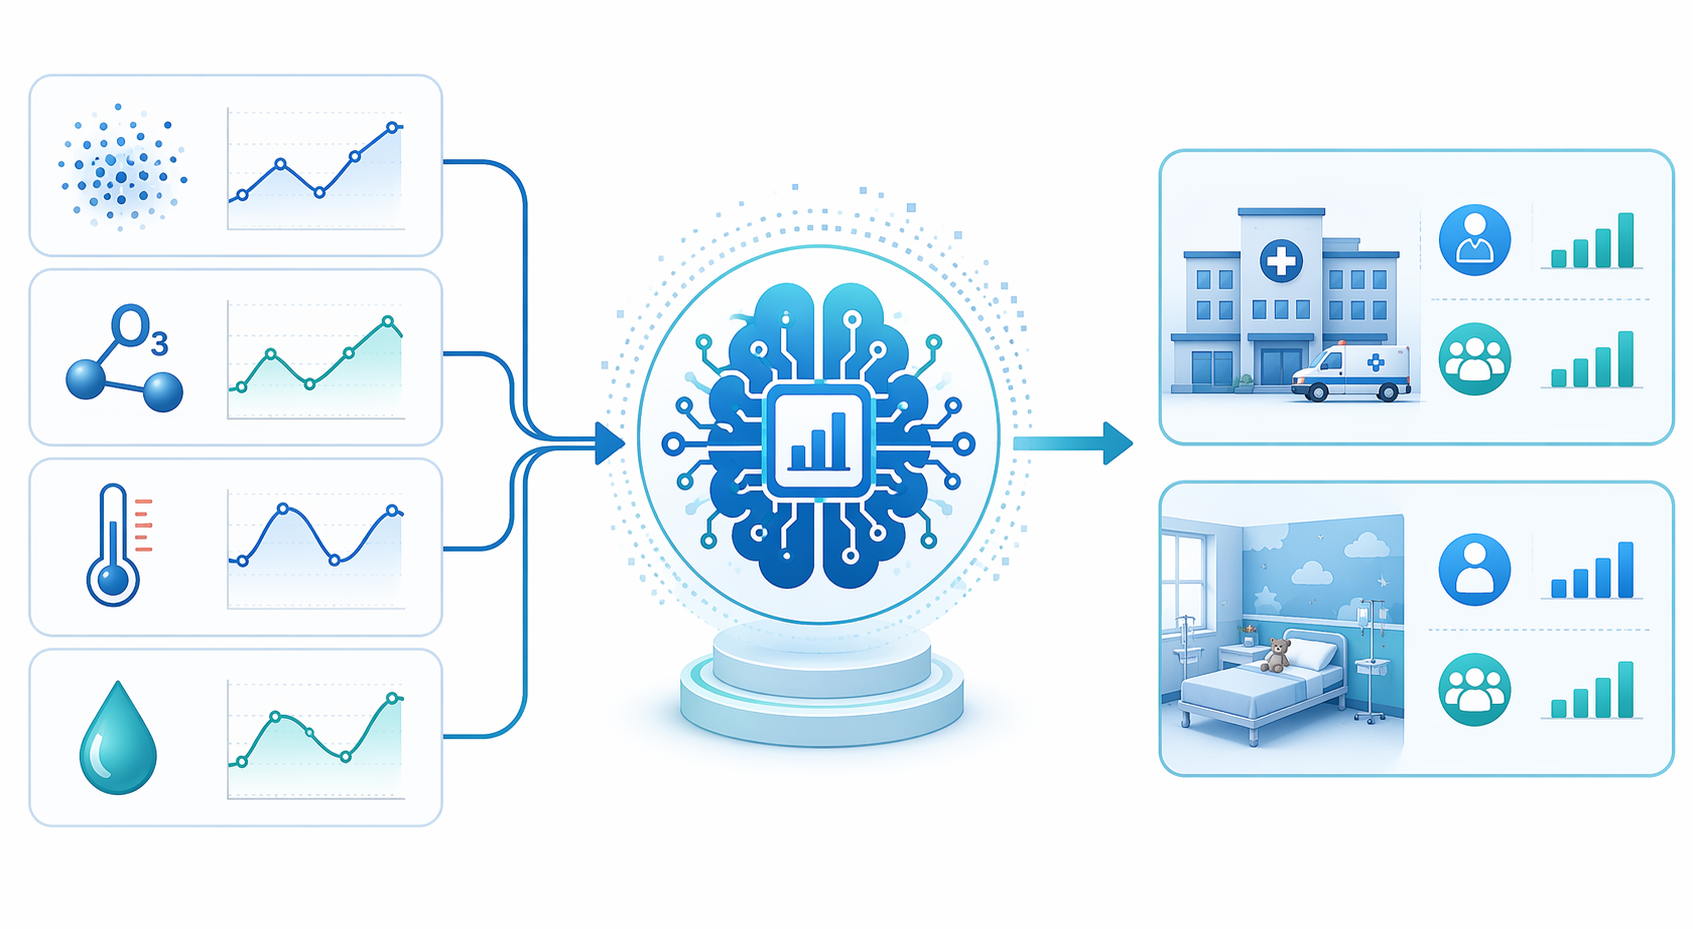
The strongest current evidence does not come from a generic benchmark in which one model beats another on pollutant concentration curves. It comes from a pediatric hospital setting in São Paulo, where Cabral-Miranda and colleagues built an AI platform that connected pollution, weather, emergency department visits, and admissions for respiratory disease. The model used PM10, ozone, temperature, and humidity to predict daily pediatric respiratory ED visits and hospitalizations, drawing on 24,366 ED visits and 2,973 admissions, and reported an AUC of 0.81 for hospital care prediction.[1]
The São Paulo Study Gets Close to the Operational Question
The São Paulo work matters because its unit of prediction is close to the thing hospitals actually feel. Pediatric respiratory visits are not an abstract environmental endpoint. They mean triage queues, oxygen needs, inhaled therapy, observation beds, admission decisions, and families waiting in a system that may already be tight.
The model’s inputs were not exotic. PM10, ozone, temperature, and humidity are exactly the kinds of variables that public health analysts already expect to watch during respiratory risk periods. The step forward is that the study tied them to daily pediatric care demand in a real hospital population rather than stopping at air quality prediction alone. In the study, every 10 micrograms per cubic meter increase in PM10 was associated with a measurable rise in pediatric respiratory admissions, and children aged 0–14 were the group most affected.[1]
That PM10 signal should be read carefully. It does not prove that an AI alert prevented an admission, and it does not prove that the same model would perform similarly in another city, climate, hospital catchment area, or pediatric population. It does show that routinely measured air and climate variables can be organized into a daily forecast that aligns with hospital-facing respiratory risk. For capacity planning, that distinction is not academic. A model can be clinically relevant before it has proved population-level admission reduction.
| Evidence Question | What the São Paulo Study Supports | What It Does Not Yet Prove |
|---|---|---|
| Can pollutant and weather data be linked to pediatric respiratory demand? | Yes. PM10, ozone, temperature, and humidity were used to predict daily ED visits and admissions. | It does not prove the same feature set will generalize without local validation. |
| Is the signal large enough to be operationally interesting? | The dataset included 24,366 ED visits and 2,973 admissions, with AUC 0.81 for hospital care prediction. | It does not show that a hospital changed staffing or reduced admissions because of the forecast. |
| Are vulnerable children identifiable as a priority group? | Children aged 0–14 were most affected in the reported age vulnerability signal. | It does not establish an individualized clinical decision rule for every child. |
This is why the study is more persuasive than a cleaner but more distant benchmark. An AUC of 0.81 is not magic; false positives and false negatives remain. But the denominator is a living service line, not a synthetic contest. A forecast attached to thousands of pediatric respiratory encounters is much easier to translate into a pilot: decide what risk threshold matters, who receives the alert, what action follows, and how the hospital will measure whether the action changed anything.
Better Pollution Forecasts Are Necessary, but Not Sufficient
The global need is not small. The State of Global Air 2025 report, using 2023 data, attributed 7.9 million deaths to air pollution, with 86% from noncommunicable diseases; it also reported more than 625,000 dementia-related deaths and estimated that 36% of the global population was exposed to PM2.5 above 35 micrograms per cubic meter.[2] Those numbers set the scale of the problem, but they do not by themselves tell a hospital what to do next Tuesday.
For that, forecasting has to narrow from burden to timing. Technical studies now show that AI models can forecast pollutant patterns with striking accuracy under controlled conditions. One scalable forecasting and classification study reported that TSMixer reached R² = 0.9861 for pollutant concentration forecasting, outperforming LSTM at R² = 0.91 and ARIMA; the same work reported Random Forest AQI classification accuracy of 99.96% with 0.029-second inference time.[3]
Those figures are useful, especially for systems that need rapid updates. They are also easy to overread. High AQI classification accuracy means the model categorized air quality states very well in that study’s data environment. It does not mean fewer children were admitted. The reported performance came from preprocessed datasets that used methods including KNN imputation and SMOTEENN balancing, which can help make model training tractable but may not fully reproduce missing sensors, calibration drift, neighborhood-level gaps, or delayed feeds in a live public health system.[3]
The same study’s SHAP analysis is more operationally interesting than the headline accuracy. Lagged ozone and PM2.5 at 24 hours were among the most influential features.[3] Lag structure matters because clinicians and public health teams need warning time. A perfect forecast that arrives after the ED has already absorbed the surge is mostly documentation. A less perfect forecast that identifies tomorrow’s risk window may be actionable.
From Five-Minute Maps to Someone Actually Getting the Alert
Real-time architecture is no longer the speculative part. A machine learning-driven framework for air quality assessment and predictive environmental health risk mapping described health risk maps and mobile alerts updated every 5 minutes, with color-coded tiers and SMS notifications intended for vulnerable populations.[4] In design terms, that is the missing middle between model output and public action: a forecast becomes a map, a tier, and a message.

But an alert pathway is not the same as a clinical intervention. For a pediatric respiratory program, the useful version has to specify who receives which warning and what they are expected to do. A family might receive an outdoor activity and inhaler-reminder message. A clinic might extend same-day respiratory capacity. A hospital might adjust staffing, respiratory therapy coverage, or observation-bed readiness. A public health department might coordinate outreach in neighborhoods where exposure and baseline vulnerability overlap.
Each of those actions has a different evidence burden. It is easier to show that an AI system can send a five-minute alert than to show that the alert changed medication adherence, reduced exposure, prevented clinical deterioration, or lowered admissions. It is also easier to generate color-coded risk tiers than to prevent alert fatigue. If every moderately polluted afternoon becomes a warning, families and clinicians will learn to ignore the signal. If thresholds are too conservative, the system will miss the days when action could have helped.
Computing Is Becoming Less of the Bottleneck
One reason pilots are becoming more plausible is that high-resolution air quality modeling is getting cheaper to run. Johns Hopkins APL and NOAA described a deep learning emulator that reduced air quality forecast computation from requiring months of data-equivalent computation to just 21 hours of input, or 7 timesteps, supporting higher-resolution forecasting at feasible cost.[5]
That work should be kept in its lane. It addresses atmospheric modeling, including ozone and wildfire smoke transport, not hospital outcomes.[5] Its clinical value is indirect: if better emulators make local forecasts faster and cheaper, health systems have a more realistic chance of receiving neighborhood-level risk estimates in time to respond. The emulator itself does not prove that pediatric admissions fall.
The distinction is especially important for regions with sparse monitoring. The places with the heaviest air pollution mortality burden often have the weakest sensor infrastructure and fewer computational resources. A model that works in a well-instrumented urban setting may perform poorly where monitors are sparse, satellite estimates are coarse, indoor exposure is unmeasured, or care-seeking patterns differ. In those places, the ethical risk is not merely technical failure. It is promising protection without building the data and response system that protection requires.
What Would Count as Hospitalization Reduction?
The phrase “reduces respiratory hospitalizations” needs discipline. There are at least four different claims that often get compressed into one.
- The model forecasts pollutant concentrations accurately.
- The model forecasts respiratory ED visits or admissions accurately.
- The forecast triggers timely clinical or public health action.
- The triggered action causally reduces admissions compared with usual practice.
The first claim is increasingly well supported in technical studies. The second is supported by a narrower set of clinical prediction studies, with the São Paulo pediatric platform as the clearest example in the materials considered here. The third depends on implementation design. The fourth still needs prospective validation against hospital admission records, ideally with predefined thresholds, workflow documentation, and comparison periods or controls.
Adjacent clinical evidence points in the same direction without settling the pediatric hospitalization question. Work in middle Tennessee found that AI-derived multi-pollutant forecasts improved 7-day COPD exacerbation prediction only when nonlinear model architectures were used, in a study population of 6,635 patients and 255,987 encounters. That adult COPD evidence is discussed separately in AI Air Quality Forecasts Enhance COPD Exacerbation Prediction. Wildfire smoke exposure adds another measurement problem, especially when indoor PM2.5 differs from outdoor estimates; that issue is covered in How AI reveals wildfire smoke's true health burden. These lines of work reinforce the broader respiratory signal, but they should not be treated as proof that pediatric admissions decline after AI alerts.
What a Serious Pilot Would Need
A credible pilot would not start with a model dashboard and hope clinicians find it useful. It would begin with the decision the forecast is supposed to change. For a pediatric hospital, that might be respiratory staffing, rapid access clinic capacity, outreach to children with known asthma, medication reminders, school or community alerts, or coordination with public health agencies during high-risk windows.
The data system would need local sensors or reliable exposure estimates, weather feeds, historical ED and admission records, and enough linkage to the EHR to identify vulnerable groups without creating an unmanageable surveillance process. The workflow would need alert thresholds that are understandable to clinical and public health teams. The evaluation would need to measure not only AUC or R², but also lead time, alert volume, response completion, missed events, ED arrivals, admissions, and unintended consequences.
The São Paulo study gives this kind of pilot a rational starting point. The technical forecasting literature suggests that rapid and scalable prediction is feasible. Real-time mapping and SMS architectures show that alerts can be delivered quickly. Computational emulator work suggests that higher-resolution forecasts may become less expensive. The remaining question is implementation evidence: whether connected sensor, forecast, alert, and clinical workflows change outcomes when used prospectively.
That is the current state of AI air quality forecasting for health protection. It is ready for well-instrumented pilots that connect environmental data to pediatric respiratory operations. It is not yet ready for broad claims that AI itself has causally reduced respiratory hospitalizations across populations.
References
- Artificial intelligence platform to predict children's hospital care for respiratory disease using clinical, pollution, and climatic factors — PMC
- State of Global Air 2025 — Health Effects Institute, October 2025
- Scalable AI-driven air quality forecasting and classification for public health applications — Springer
- Machine learning-driven framework for realtime air quality assessment and predictive environmental health risk mapping — PMC
- Johns Hopkins APL news release — Johns Hopkins APL
Comments
Join the discussion with an anonymous comment.