
After a major earthquake, the first question for AI disaster damage assessment for health infrastructure is not whether the model can draw convincing colored polygons over a city. It is whether anyone should act on those polygons when deciding which hospital, dialysis center, or pharmacy may still be usable.
The most relevant evidence so far is a peer-reviewed PLOS Digital Health study by Ramachandran et al. that overlaid two AI building-damage models with health facility locations in three Turkish cities affected by the 2023 earthquakes. The study covered 25 hospitals, 13 dialysis centers, and 454 pharmacies, then compared model classifications with reference damage assessments.[1]
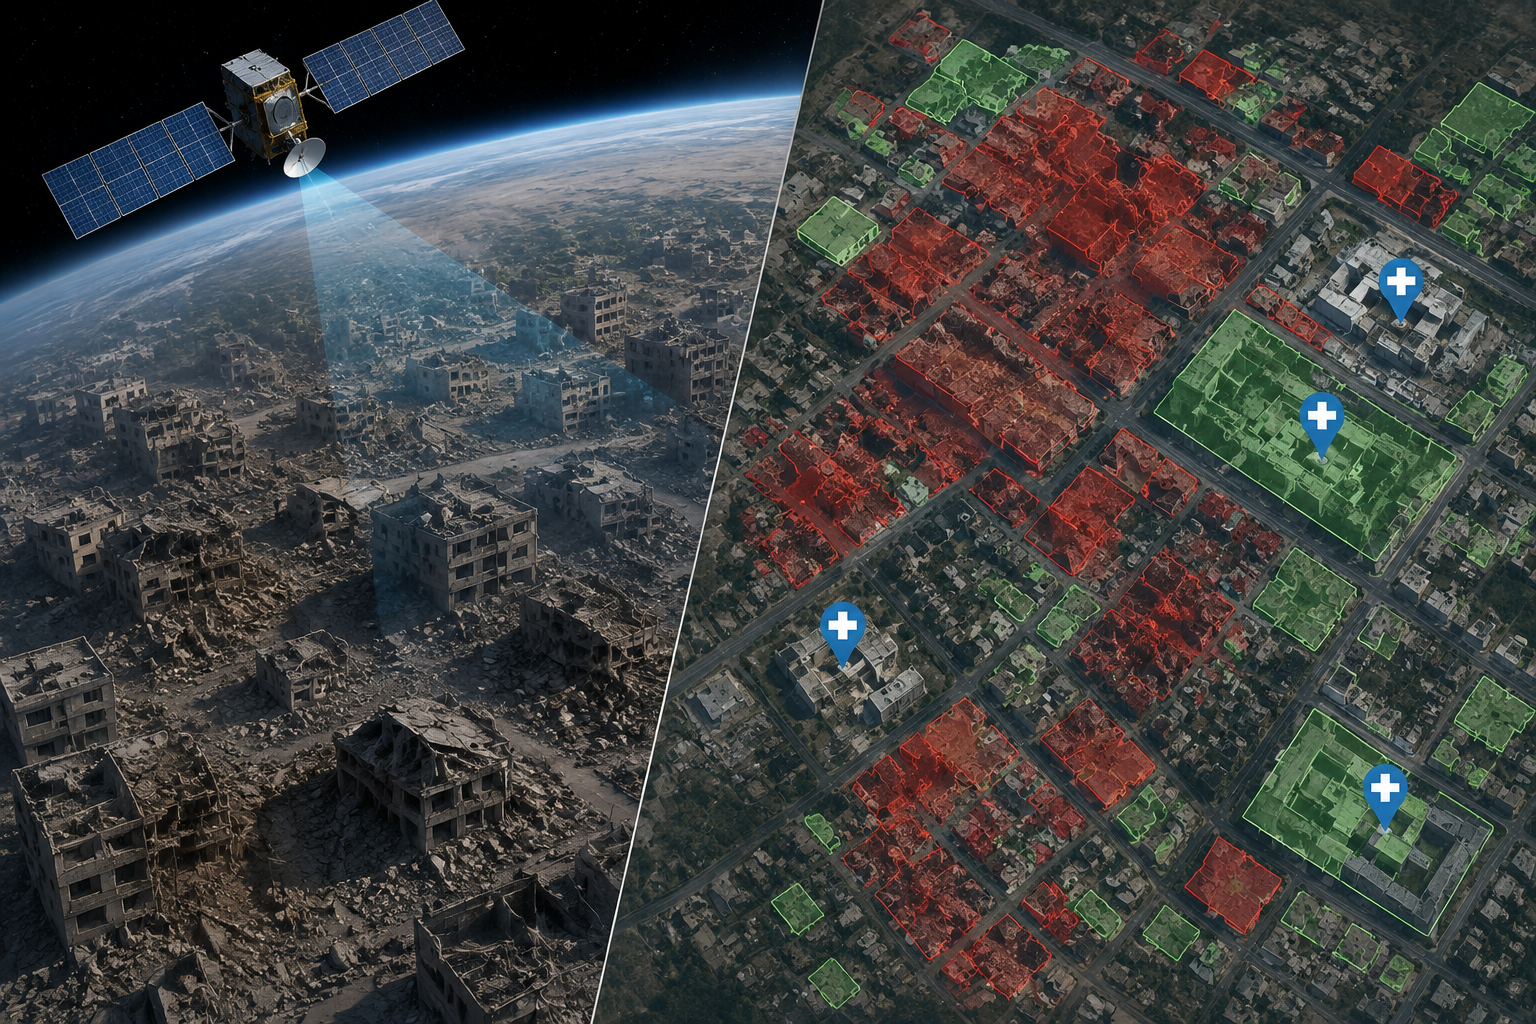
That scope matters because disaster health logistics do not run only through hospitals. A dialysis center that cannot reopen can push patients into missed treatment within days. A pharmacy on the ground floor of a mixed-use building may be the difference between continuity and interruption for people managing diabetes, hypertension, anticoagulation, or post-disaster infections. These sites are also harder to read from above than large, isolated hospital campuses.
What The Models Got Right, And What They Missed
At the individual facility level, the two evaluated systems showed fair agreement with reference assessments: Cohen’s kappa was 0.32. Their sensitivity for detecting truly damaged facilities was 42.9%, while specificity was much higher, ranging from 93.5% to 96.8%.[1]
Those numbers pull in opposite operational directions. High specificity means the models were relatively unlikely to label an undamaged facility as damaged. That is useful when responders are trying not to waste scarce calls, escorts, fuel, or engineering visits. But 42.9% sensitivity means more than half of truly damaged facilities were not detected as damaged in the study’s facility-level analysis.[1]
For a dashboard, low false alarms may look clean. For a health coordinator deciding whether a dialysis site should be treated as available, missed damage is the more dangerous side of the error. A model output that appears to clear a facility can quietly become a triage mistake if it is treated as a structural assessment rather than a remote-screening result.
| Finding | What It Measures | Operational Meaning |
|---|---|---|
| Cohen’s kappa: 0.32 | Agreement between model classifications and reference assessments beyond chance | Fair agreement, not enough to treat facility-level outputs as definitive |
| Sensitivity: 42.9% | Share of truly damaged facilities detected as damaged | Too many damaged facilities were missed for safety clearance |
| Specificity: 93.5%–96.8% | Share of truly undamaged facilities classified as undamaged | False alarms were less common than missed damage |
| 0.125 km² grid-cell sensitivity: 71.4% | Detection of damage after spatial aggregation | More useful for deciding where teams should look first |
The Destroyed-Building Error Is Not A Minor Footnote
The most troubling result was not an abstract metric. Both models systematically failed to classify some completely destroyed buildings as damaged. In the PLOS study, 6 of 11 classification inaccuracies involved buildings reduced to rubble.[1]
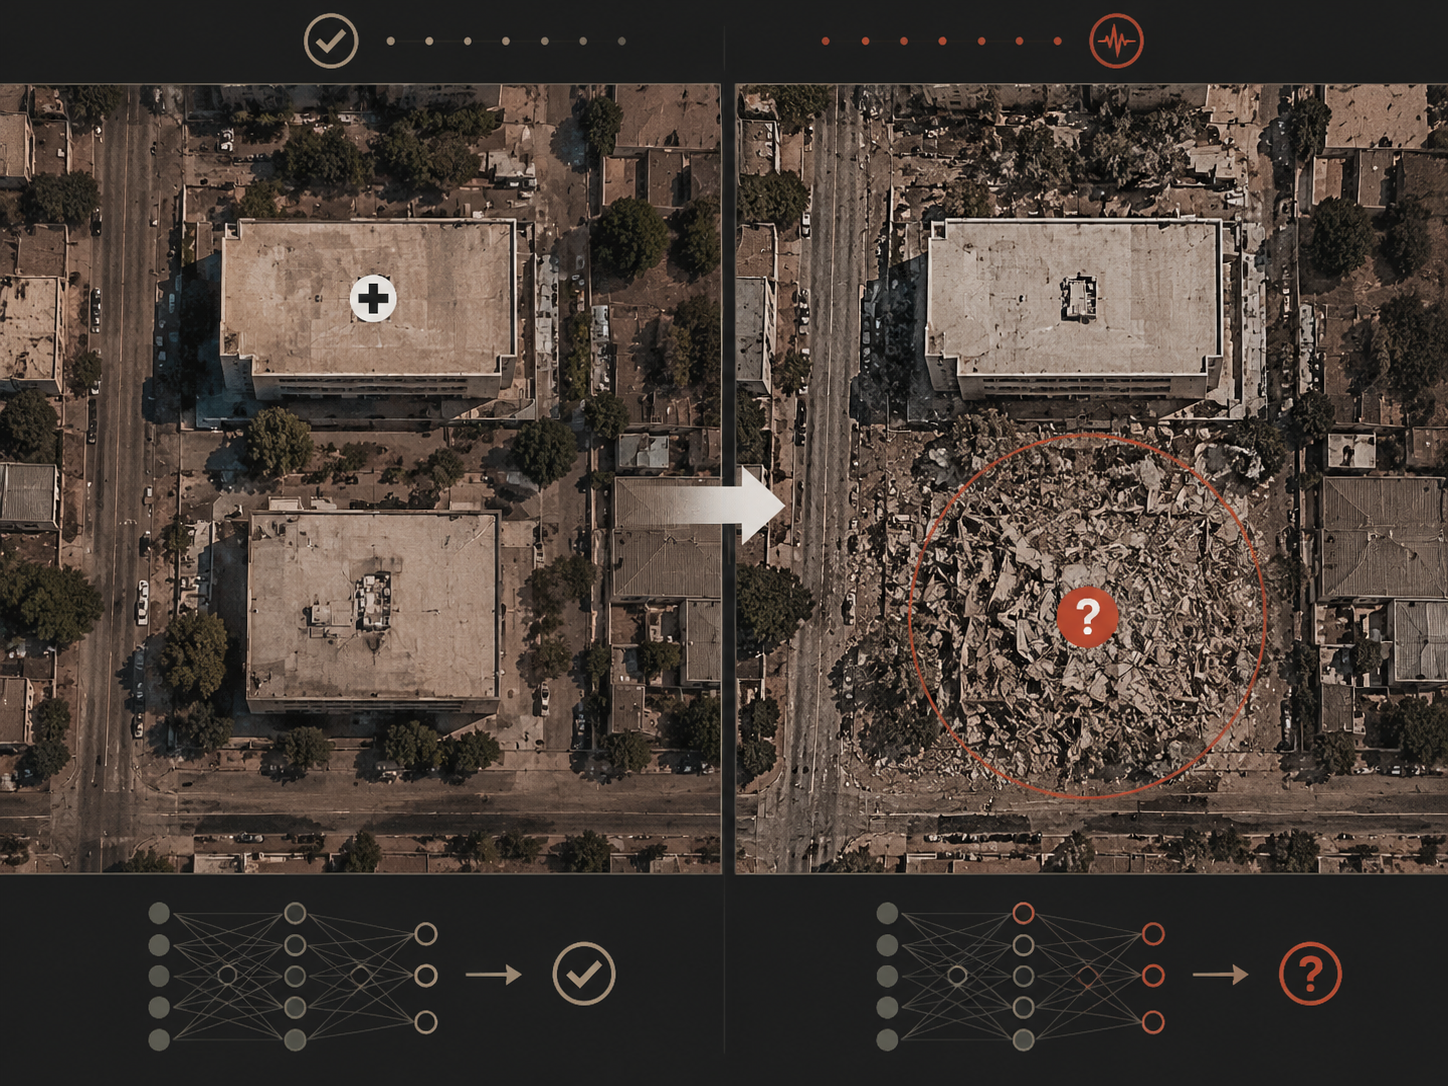
That is exactly the kind of failure a nontechnical reader might not expect. People often assume the most catastrophic visual change would be the easiest for satellite AI to catch. In practice, a pile of rubble can stop looking like a damaged building and start looking like open texture, debris, shadow, or an unrecognized footprint, depending on what the model learned to associate with damage.
This distinction matters at small health access points. If a pharmacy occupied part of a mixed-use building, the model may not be judging the pharmacy as a service location. It may be judging a building footprint, a roof pattern, or a post-event pixel signature. Direct Relief’s discussion of the work notes that smaller facilities, including pharmacies in mixed-use buildings, are harder to assess than large, isolated hospitals.[2]
A missed destroyed building should change how responders read every “no damage detected” label. The label may still be useful as one input, but it cannot carry the burden of a safety decision.
Why Aggregation Changes The Use Case
The PLOS study becomes more useful when it stops asking the model to clear an individual facility and starts asking where damage is clustered. When researchers aggregated results into 0.125 km² grid cells, sensitivity rose to 71.4%, although specificity decreased.[1]
That tradeoff is easier to defend in the first 72 hours. A grid cell with possible damage is not a declaration that every facility inside it is unsafe. It is a way to put a scarce field team, engineer, or health-system call-back list in a better order. If the model is better at identifying neighborhoods where damage is likely than at judging a specific pharmacy door, then the operational product should be a triage map, not a clearance certificate.
A practical workflow might begin with satellite-derived grid alerts, then layer in facility type, known patient dependence, road access, utility status, local reports, and phone confirmation. Dialysis centers would not wait behind lower-consequence sites simply because their roofs looked intact from orbit. Pharmacies in dense mixed-use blocks would not be assumed open because the building polygon did not trigger a damage label.
Direct Relief reported Andrew Schroeder’s projection that fully corrected health-system capacity assessments could be achievable within 42–78 hours after an event.[2] That is a plausible target for a corrected and verified workflow, not proof that satellite AI alone can deliver a trustworthy facility-status map in that window.
The Evaluated Systems Were Scalable, Not Omniscient
The PLOS study evaluated two leading satellite-image damage approaches: a Microsoft CNN-based model and Google’s two-tower CNN model.[1] Google Research has described how machine-learning-based damage assessment can compare pre-disaster and post-disaster imagery at scale, helping produce rapid building-level damage estimates after major events.[3]
The architecture is worth knowing only to the extent that it explains the deployment constraint. These systems can cover large areas quickly because they process imagery consistently across many buildings. That same distance from the ground is why they need correction. A satellite model does not smell gas, see a cracked stairwell from inside, know whether backup power is functioning, or confirm whether staff can enter safely.
Closer-range systems answer a different question. Carnegie Mellon University’s CLARKE drone-based rapid damage assessment work reports processing in under 10 minutes per scene, which can provide more proximate visual assessment than satellite imagery when drones can fly and when operators have access.[4] That is not a substitute for citywide satellite screening; it is a different layer in the same verification chain.
Microsoft’s HASTE platform, described in a July 2026 arXiv preprint, also points toward a more operationally honest interface: per-building damage maps produced in 1–2 hours, with 95% confidence intervals and per-building cloud or unknown flags.[5] The uncertainty reporting is important. A map that says “unknown” in the right places is safer than one that silently fills gaps with confidence it has not earned. But HASTE is preprint evidence, and it is not the same as peer-reviewed validation on health-facility continuity decisions.
What Should Stay Human-Controlled
The decision boundary should be explicit before the first map is opened. Current satellite AI can support rapid prioritization: which neighborhoods need ground assessment first, which facilities deserve urgent call-back, where road and access teams should expect clusters of damage, and where an apparently quiet area still needs sampling because the model’s sensitivity is limited.
- Do not use a facility-level “no damage detected” result to declare a hospital, dialysis center, or pharmacy structurally safe.
- Do use aggregated damage patterns to prioritize ground-team deployment when access, staffing, and engineering capacity are constrained.
- Treat destroyed-building misses as a known failure mode, especially where health services occupy small or mixed-use structures.
- Keep uncertainty visible, including clouds, missing imagery, unknown classifications, and areas without adequate pre-event comparison.
- Require human verification before reopening, rerouting patients, or reporting facility capacity as restored.
The human role is not ceremonial. Someone still has to decide whether a dialysis center can receive patients, whether a pharmacy can safely dispense, whether a hospital wing is accessible, and whether an apparent map gap reflects true low damage or simply poor data. AI can shorten the queue of places to check. It cannot remove the obligation to check.
Coordination Is Moving Faster Than Field Evidence
Governance efforts are beginning to catch up with deployment interest. In April 2026, the WHO Regional Office for the Eastern Mediterranean launched an AI Community of Practice for Disaster and Emergency Response Surveillance.[6] That is a coordination signal, not field-impact evidence. The harder work is agreeing on validation standards, reporting uncertainty in usable formats, and preventing model outputs from being promoted beyond what they measured.
The PLOS study remains the central evidence because it tested the question health responders actually face: what happens when AI building-damage outputs are overlaid with hospitals, dialysis centers, and pharmacies after a real earthquake? Its answer is narrow but useful. Facility-level sensitivity was too low for structural decisions. Spatial aggregation improved detection enough to support triage. Destroyed-building errors were real enough to require caution. Replication across other regions, building types, disasters, and health-system layouts is still needed.
Used within those boundaries, AI satellite damage assessment can help responders decide where scarce ground evaluation capacity should go first within days of an earthquake. Used outside them, it risks turning a fast map into a false assurance.
References
- Ramachandran et al. study on AI health facility damage assessment, PLOS Digital Health, 2025, link
- After Disaster, AI Models Support Rapid Understanding of Health Facility Damage, Direct Relief, 2025, link
- Machine Learning-Based Damage Assessment for Disaster Relief, Google Research, link
- BDA/RDA Models, Carnegie Mellon University, link
- HASTE platform, arXiv, July 2026, link
- WHO Regional Office for the Eastern Mediterranean launches AI Community of Practice for Disaster and Emergency Response Surveillance, WHO Pandemic Hub, April 16, 2026, link
Comments
Join the discussion with an anonymous comment.