
The 2023 Canadian wildfire season can now be described in a way that burned-area statistics and emergency-room snapshots could not capture. A Nature study estimated that 354 million people were exposed to at least one smoke day, with 5,400 acute deaths across North America and 64,300 chronic deaths across North America and Europe attributable to smoke-related PM2.5 from that single season.[1]
Those figures are arresting, but their public-health value depends on the machinery underneath them. They are not direct counts of smoke deaths. They are the output of a linked exposure and mortality pipeline: satellite aerosol observations, smoke plume maps, chemical transport simulations, ground monitors, machine learning retrievals, population data, baseline mortality, and exposure-response functions. The useful question is not whether AI “found” deaths that were otherwise invisible. It is whether AI-enabled air quality monitoring has made wildfire smoke exposure assessment strong enough to support burden estimates that monitors alone could never produce.
Why monitors could not carry this question
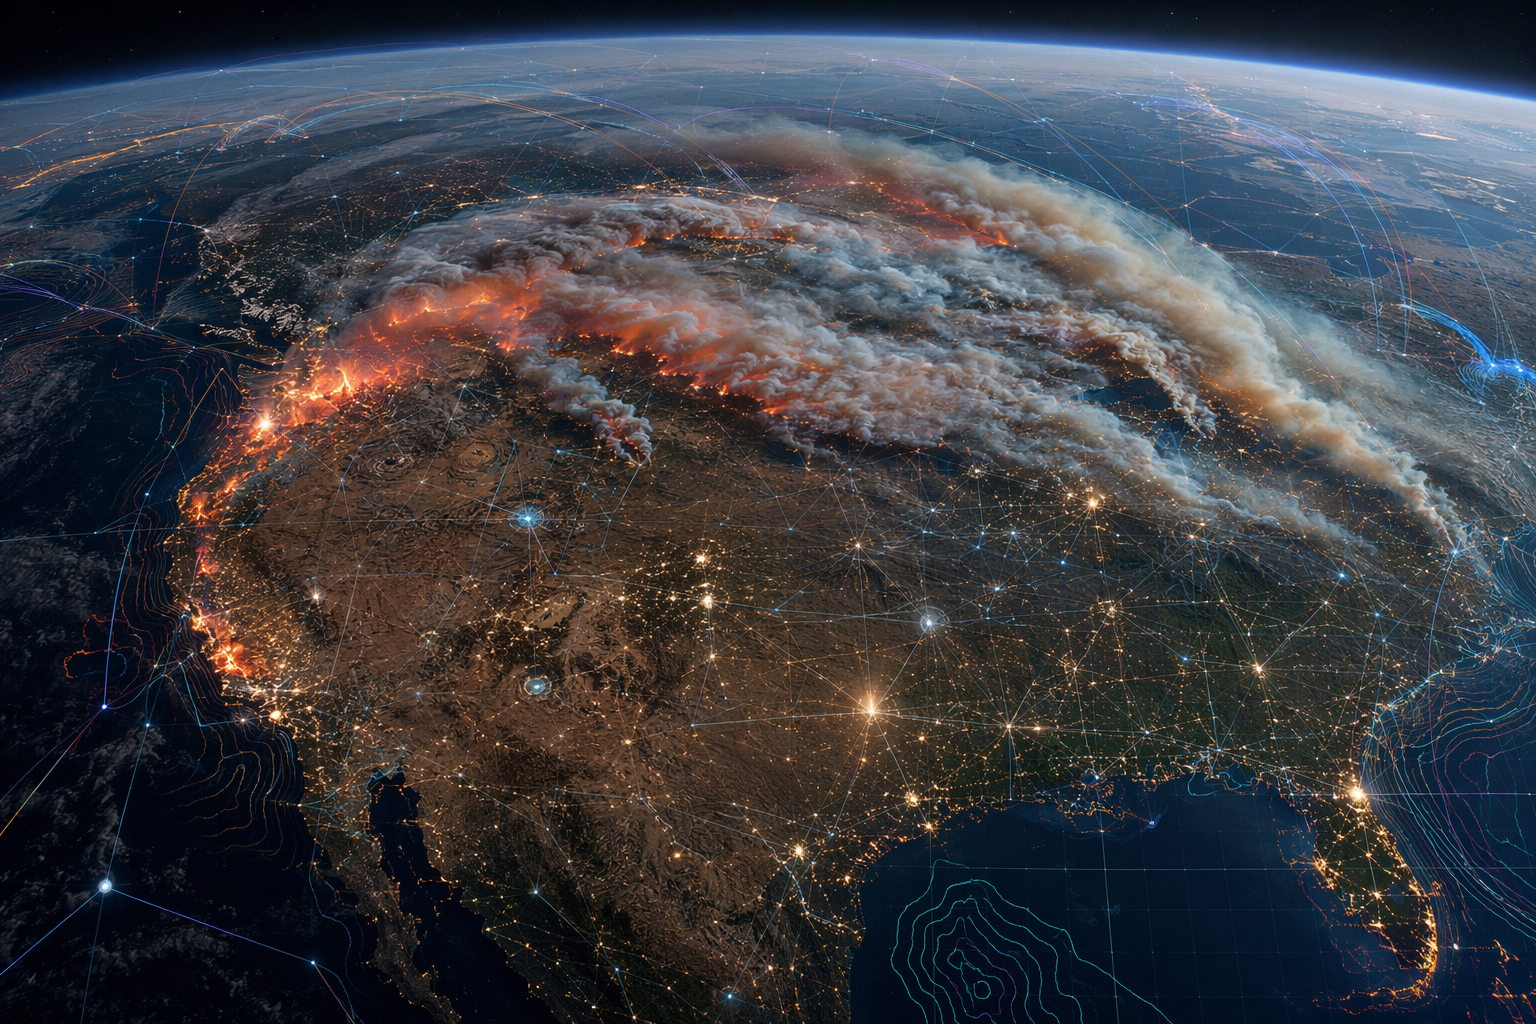
Wildfire smoke exposure is spatially uneven, temporally abrupt, and often measured best in places that already have better monitoring infrastructure. A regulatory-grade monitor can be excellent at its location and still be a poor witness for a neighboring valley, a downwind suburb, or a rural county where smoke pools overnight. That is a scientific limitation, but it is also a distributional one: if exposure is visible only where instruments are installed, the resulting health burden will be easier to quantify for populations already covered by public infrastructure.
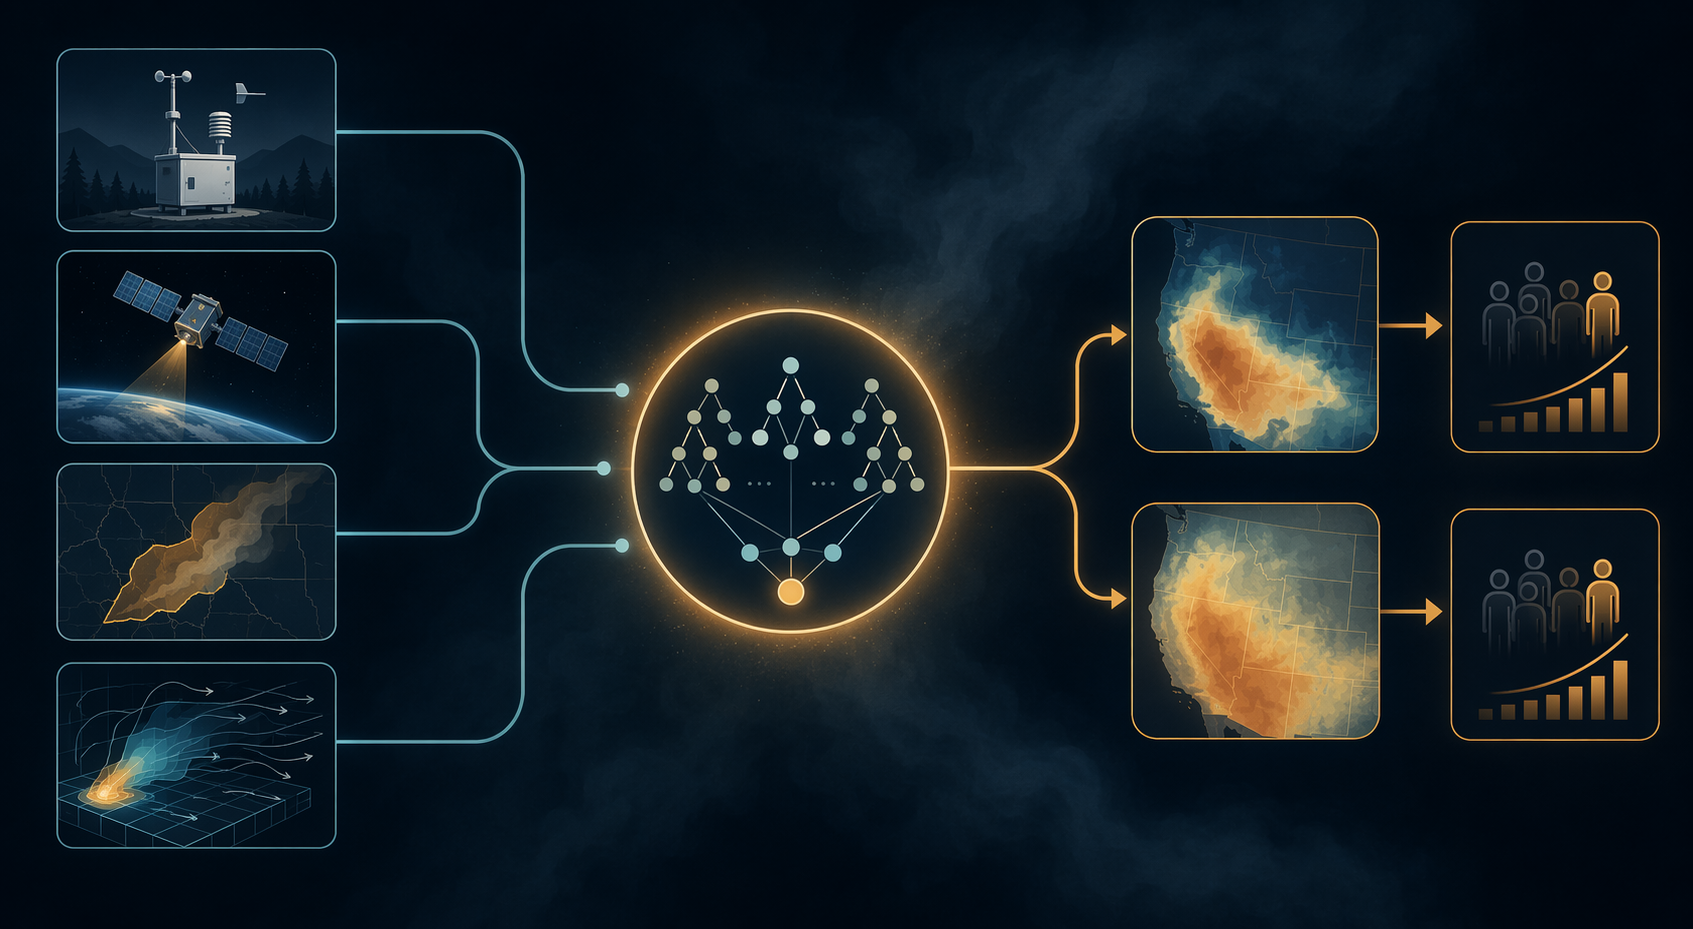
The Nature analysis addressed that gap by building daily and annual PM2.5 exposure surfaces rather than relying on monitors as the exposure field itself. Its three-layer random forest retrieval model integrated GEOS-Chem chemical transport simulations, satellite aerosol optical depth, NOAA Hazard Mapping System smoke plume polygons, and ground observations; in 20-fold cross-validation across global ground monitors, the model achieved an R² of 0.84 and an RMSE of 8.62 μg/m³.[1]
That performance statistic matters because it sits at the hinge between atmospheric modeling and epidemiology. Mortality estimation needs population exposure, not just beautiful plume imagery. The model’s task was to convert partial and differently biased signals into gridded PM2.5 estimates that could be linked to where people lived and when smoke arrived.
What each data stream contributes, and what it misses
Ground monitors anchor the system because they observe PM2.5 directly at the surface. They are also sparse relative to the scale of continental smoke transport. Satellite aerosol optical depth adds broad spatial coverage, but it observes column aerosol burden rather than breathing-zone PM2.5 and can be limited by retrieval conditions. Smoke plume polygons help identify where smoke is likely present, but a plume boundary is not a concentration measurement. Chemical transport models impose physical structure on emissions, chemistry, transport, and removal, but their outputs depend on fire inventories and model resolution.
Machine learning is useful here because the problem is not a single missing variable. It is a fusion problem. The random forest can learn relationships among modeled transport, satellite aerosol signals, plume presence, meteorology implicitly represented in the inputs, and observed PM2.5 at monitors, then apply those relationships across times and places where the monitor network is thin. This does not make the result a direct measurement. It makes it a calibrated reconstruction, and that distinction should stay visible all the way to the mortality table.
| Input | What it adds | Main limitation |
|---|---|---|
| Ground monitors | Direct surface PM2.5 observations at specific sites | Sparse coverage and uneven infrastructure |
| Satellite aerosol optical depth | Large-area aerosol signal | Column measurement, not direct ground-level exposure |
| Smoke plume polygons | Information on smoke presence and extent | Boundary does not equal concentration |
| Chemical transport model | Physically structured simulation of emissions and transport | Sensitive to fire inventories and spatial resolution |
| Random forest retrieval | Data fusion and bias correction across inputs | Learns from available observations and inherits upstream uncertainty |
Hybrid modeling is the point, not decorative AI
The strongest version of this work is not “AI replaces atmospheric science.” It is closer to the opposite: machine learning becomes most useful when it has physically meaningful inputs to correct, weight, and combine. One account of extreme-smoke prediction reported that combining machine learning with chemical transport models was 66% more accurate than chemical transport modeling alone and 12% more accurate than machine learning alone for predicting air quality during extreme smoke events.[2]
That comparison helps explain why the Nature pipeline is persuasive as an exposure model. Chemical transport simulations give the model a physically coherent first approximation of where smoke can move. Machine learning then helps close the gap between that simulated world and observed PM2.5. A purely statistical model may perform well when the training data resemble the prediction setting, but extreme smoke seasons are exactly where extrapolation risk becomes uncomfortable. A transport model alone may carry physical plausibility while missing local concentration patterns. The hybrid approach is a practical compromise, and in this use case it has become the working standard rather than a novelty.
There is field-level momentum behind that choice. A 2025 systematic review of 65 Q1 air pollution and AI studies found that machine learning methods dominate this research area, and reported Random Forest accuracy as high as 98.2% in forecasting tasks.[3] That number should not be transferred to wildfire mortality estimation; forecasting accuracy in one task is not evidence that every exposure reconstruction is equally accurate. Its more modest use is contextual: random forests and related methods are no longer peripheral tools in air pollution modeling.
From daily smoke exposure to acute deaths
The acute mortality estimate in the Nature study concerns same-season effects across North America. The exposure side of the calculation used daily PM2.5 exceedances; the health side applied exposure-response functions to estimate deaths attributable to the smoke-related increment. The result was 5,400 acute deaths during the 2023 season.[1]
This is the more intuitive part of the burden estimate because the temporal logic resembles the public experience of the event. Smoke arrives, daily PM2.5 rises, susceptible people experience higher short-term risk, and deaths are estimated against expected baseline mortality. For public health agencies, this is the time scale that maps most naturally onto advisories, sheltering guidance, emergency response, and clinical warnings for patients with cardiopulmonary vulnerability.
But even here the number is not a simple aggregation of monitored exceedances. It depends on the modeled exposure surface, the population assigned to each grid cell, the shape of the short-term exposure-response function, and the baseline mortality data. If uncertainty narrows as the pipeline moves forward only because it is no longer being shown, the precision would be misleading. The value of the study lies in carrying the atmospheric reconstruction far enough that epidemiological estimation becomes possible; the vulnerability lies in how each upstream uncertainty can propagate into the death count.
The chronic estimate is larger because the question changes
The chronic mortality estimate is not a bigger version of the acute estimate. It asks a different question: how much did smoke from the 2023 Canadian fires contribute to annual average PM2.5 exposure, and what mortality burden is associated with that contribution? On that basis, the Nature study estimated 64,300 chronic deaths across North America and Europe.[1]
That distinction is easy to lose. A person exposed to one smoke episode may appear in the acute calculation through short-term risk. The chronic calculation concerns the contribution of wildfire smoke to longer-term average exposure, using exposure-response evidence developed for annual PM2.5. The geography also expands: the acute estimate is reported across North America, while the chronic estimate covers North America and Europe, reflecting the long-range transport and annual exposure framing used in the analysis.[1]
This is why the chronic number changes the public-health interpretation of a single fire season. The season is not only a sequence of hazardous days. It becomes a measurable contribution to annual particulate exposure across a very large population. Many individuals may receive a modest increment, but when the exposed population is continental, modest increments can translate into a large mortality burden.
How the 2023 estimate compares with earlier U.S. burden work
The Nature estimate is not the only attempt to quantify mortality from wildfire smoke PM2.5. A PNAS study estimated 11,415 nonaccidental deaths per year attributable to wildland fire smoke PM2.5 in the contiguous United States for 2006–2020.[4] That estimate is useful as a comparison point because it shows that wildfire smoke mortality is not an isolated artifact of one modeling group or one extreme season.
The comparison should remain bounded. The PNAS study used a causal framework and acknowledged assumptions including homogeneity within concentration bins.[4] The Nature study reconstructed a specific 2023 transboundary smoke event and separated acute same-season mortality from chronic mortality tied to annual PM2.5 contributions.[1] The two estimates are therefore not competing headlines. They are different answers to related questions about wildfire smoke, exposure assignment, and attributable mortality.
The toxicity caveat cuts in one direction
One caveat deserves more care than it often receives. Evidence summarized by Stanford indicates that wildfire-specific PM2.5 may be about 10 times more toxic per unit mass than all-source PM2.5.[5] That does not mean the Nature mortality estimates should simply be multiplied by 10. The exposure-response functions, populations, endpoints, and concentration ranges matter.
It does mean, however, that interpretation should be conservative in a specific direction. The Nature chronic mortality estimates used exposure-response functions derived for all-source PM2.5 rather than wildfire-specific PM2.5.[1] If wildfire particles carry greater toxicity per unit mass, all-source risk functions may understate the true chronic impact of wildfire smoke. The dramatic claim is not that a multiplier can be cleanly applied; it is that the available mortality estimate may be biased low for a biologically plausible reason.
Forecasting is advancing, but it is not the evidence base for this mortality claim
There is a separate frontier in using AI to forecast wildfire emissions and smoke before events unfold. CIRES and NOAA described an AI system in development, trained on seven global fire inventories, with the aim of predicting wildfire emissions 35–45 days ahead; the same account notes limited skill on extreme seasons.[6] That work is important for preparedness, but it should not be used as support for the 2023 mortality estimate.
Retrospective burden estimation and early-warning forecasting have different evidentiary standards. A health-burden study can use observed monitors, satellite retrievals, plume products, and meteorological reality after the fact. A forecast must predict the emissions and transport before the most consequential inputs are known. Both are needed for public health, but only the retrospective hybrid reconstruction currently supports the continental mortality estimates discussed here.
What the models now make visible
The most important advance is not that an algorithm produced a large number. It is that hybrid AI-chemical transport models can now turn scattered observations and atmospheric simulations into daily and annual exposure surfaces at population scale. That makes it possible to ask a public-health question that monitor networks alone could not answer: how much mortality burden did a transboundary smoke season impose, including the chronic burden that remains after the visible plume is gone?
The answer from the 2023 Canadian wildfires is large: 5,400 acute deaths and 64,300 chronic deaths, with 354 million people exposed to at least one smoke day.[1] The estimate remains constrained by fire inventory uncertainty, the relatively coarse resolution of the GEOS-Chem framework, and the possibility that all-source PM2.5 exposure-response functions understate wildfire-specific toxicity. Those constraints do not make the burden disappear. They define the terms under which it can finally be estimated.
References
- Long-range transport of wildfire smoke from Canada to Europe in 2023, Nature, Sep 2025
- AI can help forecast air quality, but freak events like 2023's summer of wildfire smoke require traditional methods too, The Conversation
- Machine learning and artificial intelligence in air pollution research: A systematic review, ScienceDirect, Feb 2025
- Mortality burden from wildfire smoke under climate change, PNAS
- Assessing wildfire health risks, Stanford, Jan 2025
- Artificial intelligence takes wildfire emissions to a new frontier in forecasting, CIRES, Jan 2026
Comments
Join the discussion with an anonymous comment.