
In July 2026, smoke again turned a familiar public-health problem into an urgent measurement problem. Duluth, Minnesota, recorded an Air Quality Index of 934, and more than 50 EPA monitors were in the Hazardous range during the unfolding U.S.-Canada smoke episode, according to contemporaneous reporting from Yale Climate Connections.[1] Those readings tell people to stay indoors, close windows, run filtration if they have it, and avoid exertion. They do not yet say how many asthma attacks, hospital visits, lost workdays, or deaths will be attributable to this specific event. Formal health-impact estimates for the July 2026 smoke episode have not been published.
That gap is exactly where the new public-health AI literature has become consequential. The question is not whether smoke is dangerous. It is how a research team moves from smoke observed in the atmosphere to population exposure, then from exposure to attributable mortality, without pretending that a model output is the same thing as a counted death.
The 2023 fires are where the machinery has already been tested
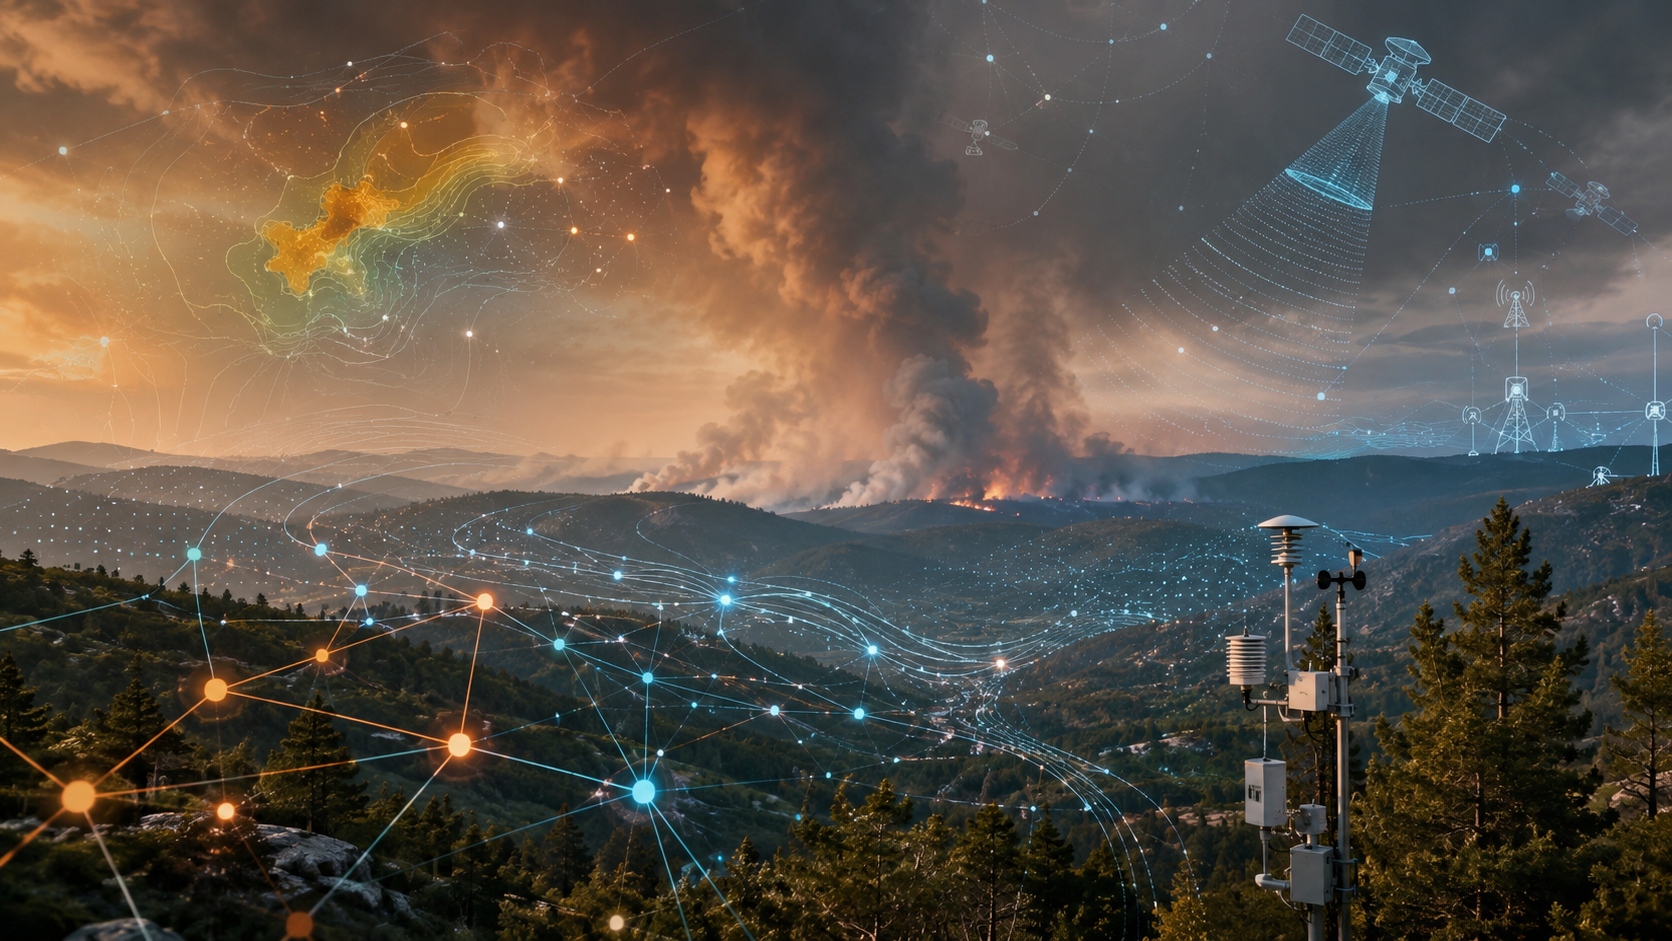
The most complete answer so far comes from the 2023 Canadian wildfire season, analyzed in a 2025 Nature study that combined satellite observations, ground monitors, meteorology, machine learning, and chemical transport modeling into a global estimate of smoke exposure and attributable deaths.[2] The scale matters: the study estimated that 354 million people in North America and Europe experienced at least one “Canada smoke day” in 2023.[2]
For the United States, the same analysis estimated that Canadian wildfire smoke increased annual PM2.5 by 1.49 µg/m³, about four times the contribution from U.S.-origin fires.[2] That is the kind of number that changes the public-health frame. A fire season in another country is no longer a remote environmental disaster; it becomes a measurable exposure imposed on a very large population.
The Nature paper’s global mortality estimates are the figures most likely to travel badly if stripped of method: 5,400 acute excess deaths and 82,100 chronic excess deaths attributed to smoke from the 2023 Canadian wildfires.[2] Those are not two versions of the same count. They come from different exposure windows and different health questions.
From smoke pixels to population exposure
The AI contribution in the Nature analysis is best understood as exposure reconstruction, not diagnosis and not death certification. The study used a three-layer random forest PM2.5 retrieval system at 0.1° resolution, drawing on satellite data, ground monitoring, meteorology, and other predictors to estimate fine-particle concentrations across space and time.[2] Against held-out observations, the model reported R²=0.84 and RMSE=8.62 µg/m³.[2]

That retrieval step is only the first handoff. The study then integrated the PM2.5 estimates with GEOS-Chem to attribute pollution to Canadian wildfire smoke rather than to background pollution, U.S. fires, traffic, industry, or other sources.[2] Only after that attribution step could the authors estimate how much population-weighted exposure came from Canadian fires.
The final handoff was epidemiological: smoke-attributable PM2.5 exposure was converted into mortality using exposure-response functions. This is where the output becomes especially easy to overread. The model does not observe deaths caused by smoke. It estimates excess deaths by applying a risk relationship to modeled exposure over a defined time window.
| Stage | What is estimated | Main dependency |
|---|---|---|
| PM2.5 retrieval | Fine-particle concentration across space and time | Satellite data, monitors, meteorology, random forest model performance |
| Smoke attribution | Share of PM2.5 attributable to Canadian wildfires | GEOS-Chem and fire emissions inventories |
| Health impact estimation | Excess mortality associated with exposure | Exposure window and PM2.5 exposure-response function |
This chain is ambitious for the right reason. Ground monitors alone are too sparse to describe long-range smoke exposure, especially when plumes cross borders and affect communities far from the fire perimeter. Satellite retrieval alone cannot settle ground-level exposure. Chemical transport alone depends heavily on emissions assumptions. The machine-learning layer helps fuse these partial views into a usable exposure surface.
It also has recognizable weak points. During fire events, the Nature model performed better in the United States than in Canada: R²=0.78 in the U.S. versus R²=0.59 in Canada, a pattern consistent with Canada’s sparser monitoring network.[2] That difference matters because the Canadian wildfire context is precisely where the monitoring network is thinner.
Why acute and chronic death estimates differ so much
The acute estimate asks what happens over short windows: days to weeks when smoke concentrations rise and people experience immediate cardiopulmonary stress. The chronic estimate asks what happens when an annual exposure increment is applied to long-term mortality risk. The same fire season can therefore produce a smaller acute number and a much larger chronic number without contradiction.
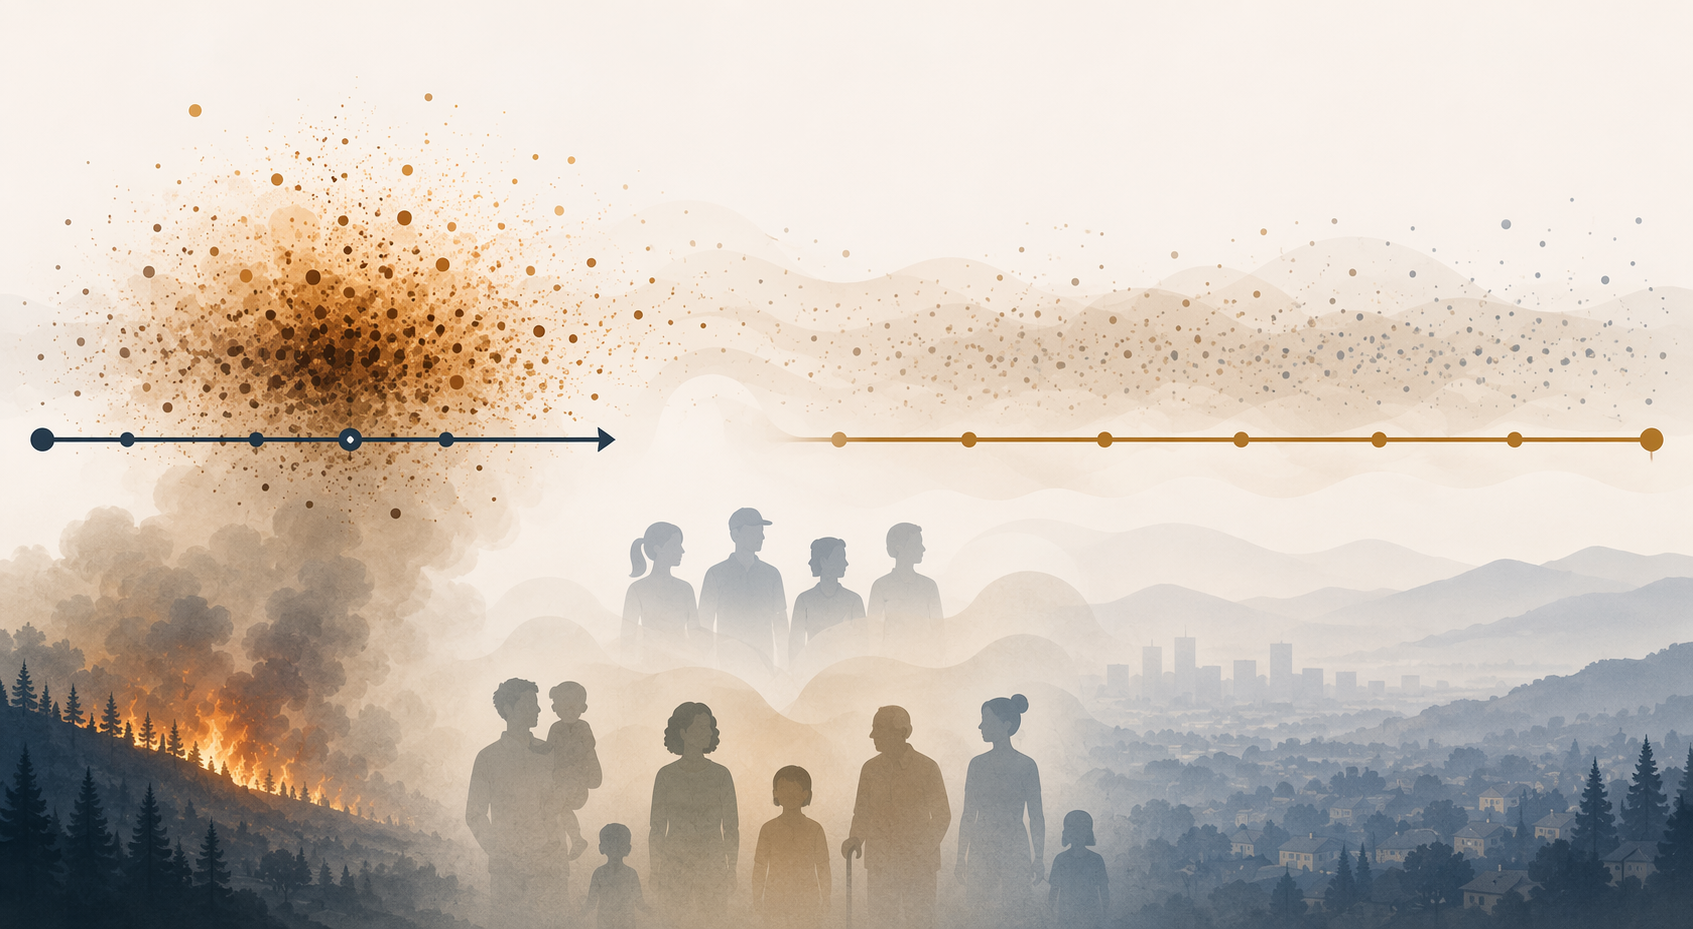
That distinction carries much of the interpretation. In the Nature analysis, the global acute mortality estimate for 2023 Canadian wildfire smoke was 5,400 deaths, while the chronic estimate was 82,100 deaths.[2] The chronic number is roughly an annualized population-risk calculation tied to sustained PM2.5 exposure, not an assertion that tens of thousands of individual death certificates identified wildfire smoke as the cause.
A Canada-specific analysis published in GeoHealth by Health Canada researchers gives the same distinction in a narrower geography. Using the FireWork/GEM-MACH framework, it estimated 400 acute deaths in Canada from wildfire smoke PM2.5 in 2023, while the chronic mortality estimate for Canada in 2023 was 5,400 deaths.[3] Across 2019–2023, the same study estimated 49–400 acute deaths per year and a long-term average of 1,900 chronic deaths per year.[3]
The Canada analysis also translated the 2023 chronic burden into economic and population-health terms: $52 billion in chronic mortality valuation for 2023 and a population-weighted life expectancy decrease of 0.06 years.[3] Those figures are useful for public-health planning, but they are downstream of the same modeling choices: smoke attribution, exposure window, baseline population risk, and the toxicity curve chosen for PM2.5.
Near-real-time does not mean model-only
The public value of these systems is speed. Emergency managers, clinicians, and health departments do not get to wait several years for settled epidemiology before deciding whether to open clean-air shelters, warn outdoor workers, adjust school activities, or prepare respiratory and cardiovascular services. A near-real-time exposure surface, even an uncertain one, is better than an AQI map with no population denominator.
But the 2023 season also showed why “AI” should not be treated as a self-sufficient answer. A 2023 analysis in The Conversation noted that during extreme wildfire smoke events, AirNow’s machine-learning forecasts still needed augmentation from traditional smoke-transport models.[4] That is not a failure of machine learning. It is a reminder that rare, high-intensity events often sit outside the comfortable center of a training distribution.
For public-health use, this boundary is practical. AI-derived exposure estimates can help identify where risk is accumulating and which populations may need targeted outreach. They do not remove the need for atmospheric physics, emissions accounting, local monitoring, clinical judgment, or indoor-exposure information. Outdoor PM2.5 surfaces are still proxies for what people actually breathe inside homes, workplaces, schools, vehicles, and shelters.
The emissions inventory is a technical choice with health consequences
The most concrete uncertainty is upstream of the health model: how much smoke was emitted in the first place. Fire emission inventories do not agree neatly. In the U.S., QFED-based PM2.5 estimates were 59–70% higher than GFED-based estimates in the Nature analysis.[2] A mortality estimate built on QFED will therefore not mean the same thing as one built on GFED, even if the exposure-response function is unchanged.
This is where traceability matters more than the elegance of the model. If a paper reports a large excess-death estimate, the first question should be which smoke inventory fed the attribution step. The second should be whether the estimate was validated against ground monitors in the affected geography. The third should be whether the uncertainty interval reflects inventory choice or only statistical uncertainty inside one pipeline.
The ±5x uncertainty described across methodological choices is not a decorative caveat. It is the difference between using these outputs as bounded public-health estimates and using them as a false precision device. A decision-maker may still act under that uncertainty, but the uncertainty should travel with the number.
The toxicity curve may be the more consequential clinical uncertainty
After emissions, the next pressure point is the exposure-response function. The health-impact estimates use functions derived from all-source PM2.5, not wildfire-specific PM2.5.[2][3] That is a necessary compromise in a field where long-term wildfire-specific epidemiology remains thinner than the need for action.
It is also clinically important. The research brief notes emerging evidence that wildfire PM2.5 may be substantially more toxic per unit mass than fossil-fuel PM2.5. If that is true, then all-source PM2.5 curves may understate the harm from smoke, even while other parts of the pipeline may overstate or understate exposure depending on the emissions inventory.
That combination makes the mortality estimates easy to misuse in both directions. Calling them speculative ignores the measured exposure signal and the validated retrieval work. Treating them as a direct body count ignores the inventory disagreement, the monitoring gaps, the acute-versus-chronic split, and the non-wildfire-specific toxicity curve.
Forecasting is moving upstream
The next technical frontier is not only estimating exposure after smoke appears, but forecasting emissions before exposure fully unfolds. NOAA and CIRES described AI-driven subseasonal-to-seasonal wildfire emissions forecasting work in January 2026 that combines seven global fire inventories with meteorological data to forecast emissions 35–45 days ahead.[5] That is not yet a replacement for health-impact assessment, but it shows where the pipeline is moving: earlier smoke estimates, earlier exposure forecasts, and potentially earlier public-health response.
For now, the strongest claim is narrower and more useful. Machine-learning fusion models have made the health impact of Canadian wildfire smoke measurable at continental and global scales in a way older monitor-only approaches could not. They can estimate who was exposed, by how much, over which window, and with what expected mortality burden under specified assumptions.
They cannot yet turn a smoke plume into an observed death count. The published figures are bounded estimates shaped by emissions inventories, monitoring density, exposure windows, chemical transport attribution, and PM2.5 toxicity curves that are still not wildfire-specific. That is enough to inform public health. It is not enough to stop asking how the number was made.
References
- Dangerous and historic wildfire smoke pollution event engulfs the U.S. and Canada, Yale Climate Connections, July 2026.
- Long-range PM2.5 pollution and health impacts from the 2023 Canadian wildfires, Nature.
- Health Impact Analysis of Wildfire Smoke-PM2.5 in Canada 2019–2023, GeoHealth.
- AI can help forecast air quality, but freak events like 2023’s summer of wildfire smoke require traditional methods too, The Conversation.
- Artificial intelligence takes wildfire emissions to new frontier in forecasting, CIRES, January 2026.
Comments
Join the discussion with an anonymous comment.