
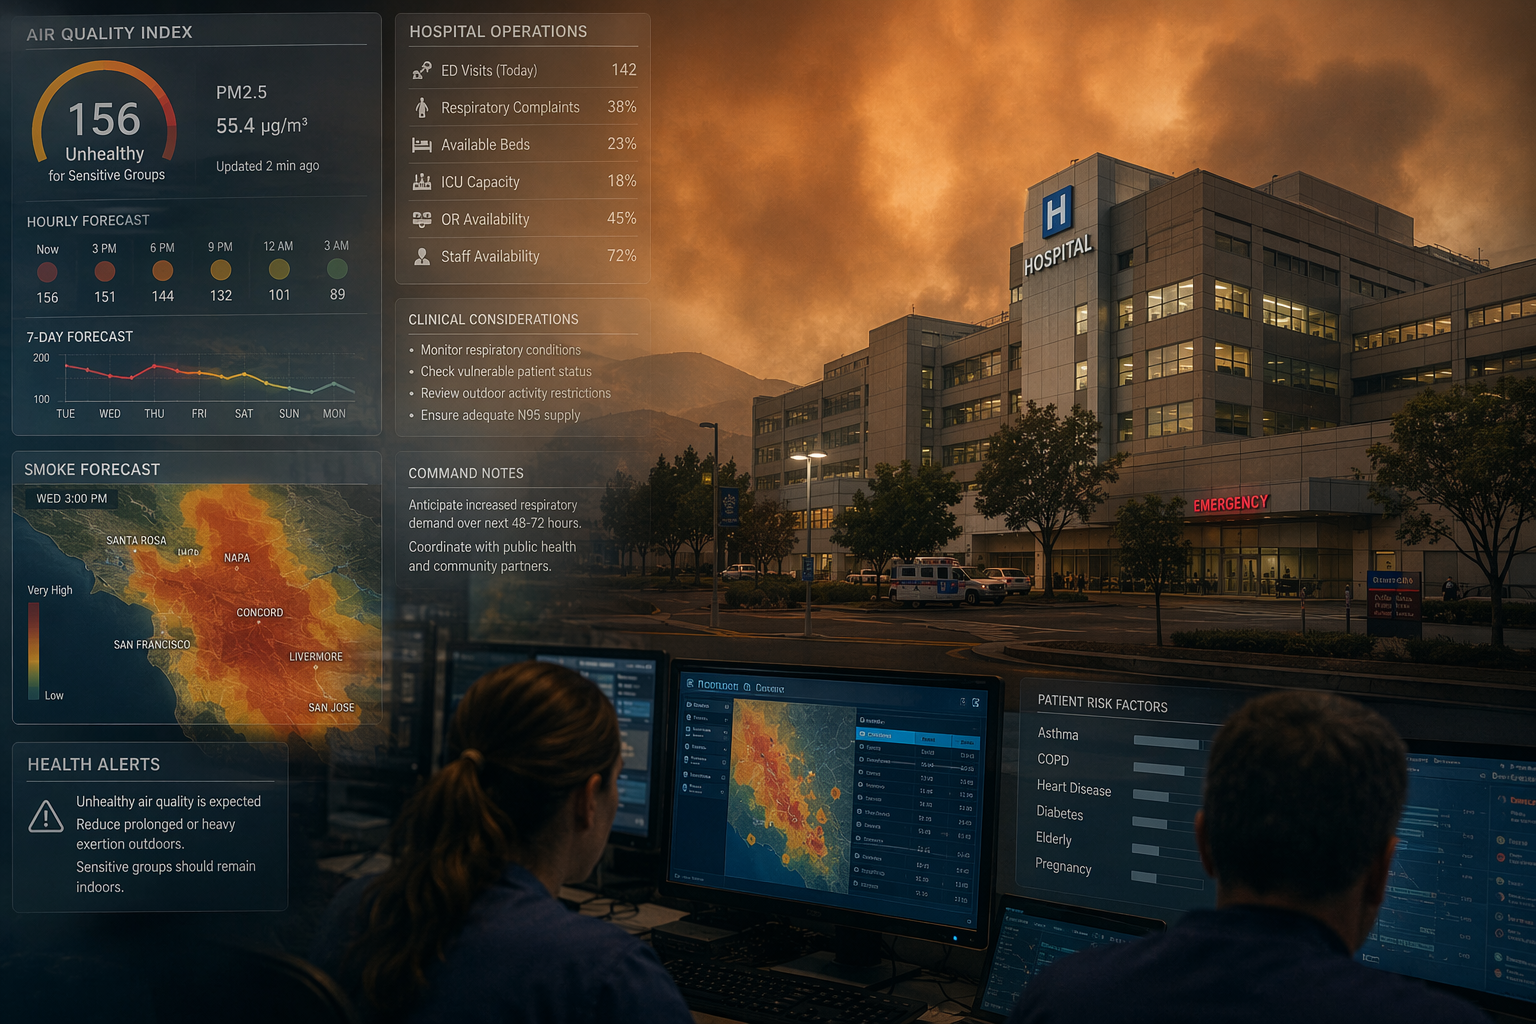
For a hospital, wildfire smoke becomes urgent well before the waiting room fills. The useful question is not whether artificial intelligence can produce a better-looking smoke map. It is whether a forecast arrives early enough, at the right geographic scale, and in a form that can change staffing, bed planning, respiratory clinic capacity, outreach, supplies, or triage rules. That is where air-quality health and safety measures during wildfire smoke begin to move from public advice into clinical operations.
The evidence now points in two directions at once. Wildfire smoke PM2.5 is associated with measurable same-day respiratory morbidity, including a 0.36% increase in respiratory emergency department visits, a 0.25% increase in hospitalizations, and a 0.15% increase in all-cause mortality for each 1 μg/m³ increase in PM2.5; effects have also been reported as persisting up to 3 years.[1] At the same time, AI-enhanced smoke forecasting is beginning to offer lead times that match recognizable hospital decision windows: several days for staffing and capacity, and several weeks for seasonal preparedness.
What has not yet been demonstrated in peer-reviewed literature is the full operating chain: an AI smoke forecast entering a health system, triggering predefined thresholds, changing clinical resources, and then being evaluated against respiratory surge outcomes. The components are coming into view. The protocol is still the missing piece.
The clinical signal is strong enough to plan around
A hospital does not need every causal pathway solved before it prepares for a predictable respiratory burden. The Stanford meta-analysis is important because it places wildfire smoke PM2.5 in the language of utilization and outcomes rather than atmospheric exposure alone. A same-day increase in respiratory ED visits is not an abstract environmental endpoint; it is a registration desk, an ED charge nurse, a respiratory therapist, a bed manager, and a discharge bottleneck receiving the downstream signal at roughly the same time.[1]
The projected long-term burden is larger still. A Nature 2025 machine-learning ensemble study projected 71,420 excess deaths per year from smoke PM2.5 by 2050 under a high-warming scenario.[2] That estimate is useful for strategic planning, but it can feel remote inside a daily operations meeting. For preparedness, the more immediately actionable fact is that smoke-related morbidity is already measurable at the time scale when emergency departments and inpatient units make staffing and capacity decisions.
That distinction matters. A health system cannot staff a July ED shift around a 2050 mortality projection. It can, however, adjust respiratory clinic hours, call-in criteria, oxygen and nebulizer supply checks, telehealth messaging, community outreach, and transfer awareness if a credible forecast shows a smoke plume reaching its service area in the next several days.
Different forecast horizons support different hospital decisions
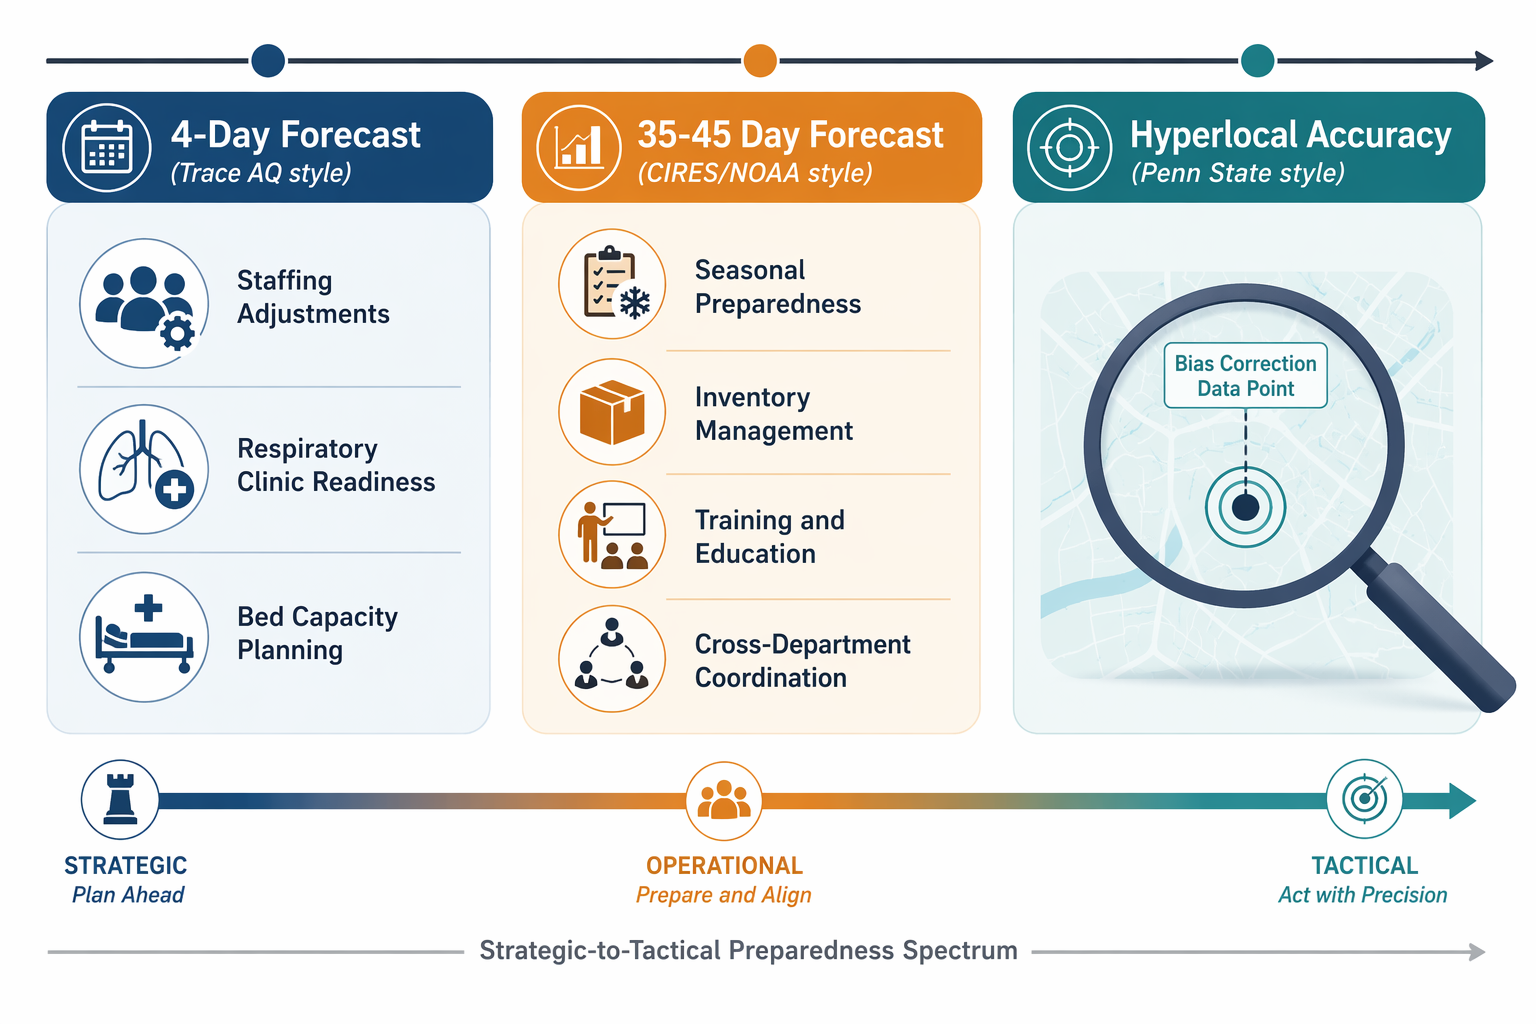
The operational value of an AI smoke forecast depends heavily on its horizon. A 4-day forecast and a 45-day emissions signal should not be judged by the same standard, because they do not belong in the same meeting.
| Forecast window | Evidence example | Best-fit hospital use | Decision it should not be asked to make |
|---|---|---|---|
| 4 days | Trace AQ hyperlocal PM2.5 forecasting | ED staffing, respiratory clinic readiness, bed-capacity review, near-term patient outreach | Long-range seasonal inventory strategy |
| 35–45 days | CIRES/NOAA AI-driven wildfire emissions model | Seasonal preparedness, training, supply chain review, cross-department coordination | Same-week staffing or diversion decisions |
| Event-level hyperlocal correction | Penn State deep learning bias-reduction during June 2023 Canadian wildfires | Improving local confidence during severe smoke episodes | Replacing local validation or exposure assessment |
The University of Utah’s Trace AQ tool is the closest fit for acute health-system operations because it combines the CMAQ chemical transport model with machine learning to deliver 4-day hyperlocal PM2.5 forecasts designed for health-system decision windows.[3] Four days is not much time for capital planning, but it is meaningful time for hospital operations. It can put a forecast on the agenda before the weekend schedule is locked, before respiratory therapy coverage becomes improvised, and before ambulatory teams decide whether high-risk patients need additional outreach.
A 4-day smoke forecast could support a structured operational huddle: expected PM2.5 range by service area, vulnerable populations in the catchment, ED staffing variance, respiratory therapy availability, inpatient bed constraints, clinic access, and public-facing messaging. None of those actions require the forecast to be perfect. They do require the forecast to be specific enough that a hospital can decide whether to prepare for a routine bad-air day or a likely respiratory surge.
The CIRES/NOAA model works on a different clock. Presented at AMS 2026, it uses meteorological predictors and machine learning to predict wildfire emissions 35–45 days in advance.[4] That time frame is too early and too uncertain for deciding how many nurses should work a particular ED shift. It is well suited to preparedness questions that usually suffer from late attention: whether respiratory surge training has been refreshed, whether supply assumptions are realistic, whether community clinics and inpatient units are aligned, and whether command-center roles are clear before smoke arrives.
The Penn State deep learning result addresses a more technical but operationally important problem: bias during severe smoke events. During the June 2023 Canadian wildfires, the model reduced PM2.5 forecast bias from −6.87 μg/m³ to +0.16 μg/m³.[5] For a command center, that kind of correction is not a modeling footnote. Underestimating severe smoke can leave the ED and respiratory teams reacting after the surge has begun; overestimating it too often can exhaust credibility and trigger unnecessary resource movement.
Lead time is not the same as readiness
The preparedness literature explains why better forecasts do not automatically become better care. A 2024 Lancet Planetary Health review identified inadequate training, siloed disciplines, and insufficient coordination as barriers to health-system preparedness for wildfires.[6] Those are not problems a forecast model can solve by itself. They are governance problems.
A smoke forecast that lands in an inbox is information. A smoke forecast tied to thresholds, roles, and escalation authority is a clinical operations tool. The difference is whether the organization has already decided who reviews the forecast, what level of predicted PM2.5 matters, which patient groups trigger outreach, when respiratory therapy leadership is notified, when ambulatory clinics adjust access, and when supply checks become mandatory rather than optional.
The most defensible near-term workflow would probably start modestly. A health system could define a smoke-readiness tiering system for its service area, integrate a forecast feed into emergency preparedness or command-center review, and preassign actions for each tier. Lower tiers might prompt monitoring and public messaging review. Higher tiers might prompt respiratory staffing review, ED fast-track planning, vulnerable-patient outreach, pharmacy and oxygen supply checks, and coordination with ambulatory clinics.
That pilot would still need validation. The question is not only whether the model predicted ambient PM2.5. It is whether the forecast-supported actions improved readiness without creating excessive false alarms, staffing strain, or resource diversion. A health system should be able to look back after a smoke episode and ask whether the forecast changed a decision, whether the decision was timely, and whether the observed utilization pattern justified the trigger.
Where forecast output can mislead clinical operations
Three uncertainties deserve more attention than they usually receive in optimistic AI discussions: spatial resolution, indoor exposure, and behavioral confounding.
Spatial resolution matters because hospital catchment areas are not uniform exposure zones. A regional smoke signal may be too broad for deciding which clinic network, mobile team, or ED campus should prepare first. Hyperlocal forecasting helps, but it does not remove the need to compare predicted exposure against local monitor data, satellite-derived estimates, terrain, wind patterns, and the actual geography of a health system’s patients.
Indoor exposure is harder. Ambient monitoring captures outdoor conditions, while patients spend much of their time indoors. Housing quality, filtration, workplace exposure, access to clean-air spaces, and the ability to shelter all change the clinical relevance of the same outdoor PM2.5 value. A forecast can identify risk, but it cannot by itself tell a hospital which patients experienced the highest personal exposure.
Behavioral confounding is especially important at extreme PM2.5 levels. Stanford NBER research from 2023 found a nonlinear response in which ED visits decline at extreme PM levels because people shelter in place.[7] For hospital leaders, that finding should complicate any simple reading of utilization data. A lower-than-expected ED count on an extreme smoke day may reflect reduced exposure, delayed care-seeking, transportation barriers, fear of going outside, or some combination of those forces. It should not automatically reassure an operations team that the health burden is lower.
What a pilot should prove
The next useful step is not a claim that AI has solved wildfire-smoke surge planning. It is a carefully bounded pilot that tests whether forecast-informed action improves preparedness. The pilot should be judged on operational performance, not model novelty.
- Forecast fit: whether the forecast horizon matches a real decision window, such as 4-day staffing review or 35–45-day seasonal preparation.
- Threshold design: whether predicted PM2.5 levels are tied to explicit escalation tiers rather than ad hoc concern.
- Governance: whether emergency medicine, respiratory therapy, ambulatory care, population health, facilities, pharmacy, and communications know who acts.
- Equity of outreach: whether high-risk patients and smoke-vulnerable communities are identified before the surge, not after utilization rises.
- After-action validation: whether the system measures false alarms, missed events, staffing effects, ED volume, respiratory complaints, hospitalizations, and delayed care signals.
A health system starting this work does not need to build a perfect surveillance apparatus on day one. It does need to avoid treating the forecast as a standalone dashboard. The clinical value appears when the forecast is attached to accountable decisions: who is called in, which clinics extend access, which patients receive outreach, which supplies are checked, which messages go out, and when the organization stands down.
Current AI smoke forecasts appear capable of giving health systems meaningful lead time for respiratory surge planning. The strongest use case is not full automation; it is earlier, more disciplined preparedness. Until spatial resolution, indoor exposure, behavioral confounding, and clinical validation are better resolved, the responsible claim is narrower: these tools are ready for operational pilots, not for declarations that the forecast-to-clinical-action pipeline is already proven.
References
- Stanford meta-analysis linking wildfire smoke PM2.5 to respiratory morbidity. Annual Review of Medicine, 2024.
- Nature 2025 ML ensemble study projecting excess deaths from smoke PM2.5 by 2050. Nature, 2025.
- Trace AQ tool. Utah Price College of Business, August 2025.
- AI-driven emissions model predicting wildfire emissions 35–45 days in advance. CIRES/NOAA, 2026.
- Deep learning model reducing PM2.5 forecast bias during the June 2023 Canadian wildfires. ScienceDaily, May 2024.
- Health-system preparedness for wildfires review. The Lancet Planetary Health, 2024.
- Stanford NBER 2023 nonlinear response study on ED visits at extreme PM levels. Stanford NBER, 2023.
Comments
Join the discussion with an anonymous comment.