
The hard part of AI in air quality monitoring and health impact prediction is not teaching a model to recognize a bad pollution day. It is deciding when a modeled exposure estimate is strong enough to support a claim about asthma exacerbations, respiratory admissions, mortality risk, or the neighborhoods likely to bear the next clinical burden.
A plausible pipeline now exists. Pollutant and meteorological data are gathered from monitoring stations, satellites, low-cost sensors, traffic proxies, land-use variables, and weather feeds. AI models estimate or forecast concentrations across space and time. Demographic and vulnerability layers add age structure, comorbidities, socioeconomic status, and sometimes healthcare-access indicators. The final health-risk output is then generated either by a direct predictive model trained against health records or by a hybrid method that connects AI-estimated exposure to established concentration-response functions.

That sequence matters because each stage carries a different evidentiary burden. A model can classify air quality with impressive accuracy and still leave the health-risk layer under-validated. A hospital-admission forecast can fit one city’s historical data very closely and still fail when the same logic is moved to a different hospital network, pollutant mixture, coding practice, or population age structure.
From Pollution Estimates To Health-Risk Outputs
The most clinically relevant AI systems do more than fill gaps between monitoring stations. They translate exposure estimates into a risk surface: where risk is likely to rise, which groups may be more vulnerable, and when public health or clinical services may need to prepare for additional demand.
| Pipeline stage | What AI contributes | What must be checked before health claims are made |
|---|---|---|
| Pollutant and weather inputs | Combines station, sensor, satellite, traffic, land-use, and meteorological signals | Coverage, calibration, missingness, pollutant mix, and whether the inputs represent the deployment setting |
| Exposure estimation or forecasting | Predicts pollutant concentrations across neighborhoods, time windows, or unmonitored locations | External validation, temporal drift, spatial transferability, and uncertainty reporting |
| Vulnerability overlay | Adds age, comorbidity, socioeconomic, and neighborhood-level indicators | Whether the variables are measured consistently and whether they encode structural inequities without obscuring them |
| Health-risk prediction | Links exposure estimates to admissions, exacerbations, mortality, or burden estimates | Whether endpoints are real, simulated, retrospective, prospectively validated, or grounded in epidemiologic concentration-response functions |
This is where population-level tools look more mature than bedside tools. A health department can use a neighborhood risk map to prioritize surveillance, outreach, staffing discussions, or research recruitment without pretending that the model has diagnosed an individual patient. A clinician-facing alert that estimates a specific patient’s risk tomorrow carries a higher evidentiary bar: the model must be calibrated for that population, tied to meaningful outcomes, interpretable enough to challenge, and shown to improve decisions rather than simply add another warning to the workflow.
The Technical Momentum Is Real, But The Metrics Are Not Interchangeable
Recent studies show why interest has accelerated. One machine-learning framework reported Random Forest accuracy up to 98.2% for AQI classification and an ANN-MLP model with R² = 0.9918 for forecasting respiratory-disease hospital admissions using air pollutant and meteorological inputs.[1] Another public-health-oriented forecasting study reported a TSMixer model with R² = 0.9861 for pollutant concentration forecasting.[2]
Those are strong reported results. They also measure different things. AQI classification accuracy is not the same as a forecast of respiratory admissions. Pollutant concentration fit is not the same as clinical utility. R², classification accuracy, and admission-forecast performance can come from different cities, time periods, pollutant sets, sampling densities, and outcome definitions. Treating them as a single leaderboard would make the field look cleaner than it is.
For clinical and public health readers, the useful question is narrower: What was the endpoint, and how close was it to the decision someone wants to make? A model that estimates PM2.5 tomorrow may support exposure surveillance. A model that forecasts respiratory admissions may support capacity planning if it has been tested against local admission records. A model that claims individual risk for a child with asthma requires a different level of prospective validation and clinical accountability.
Why Hybrid Models Are Often More Convincing
Traditional health impact assessment tools such as GEMM, BenMAP-CE, and AirQ+ rely on statistical exposure-response functions. Their strength is epidemiologic grounding: they make the health-risk conversion visible and tie it to established population-level relationships. Their weakness is that they can oversimplify nonlinear, multi-pollutant interactions that matter in real environments.[3]
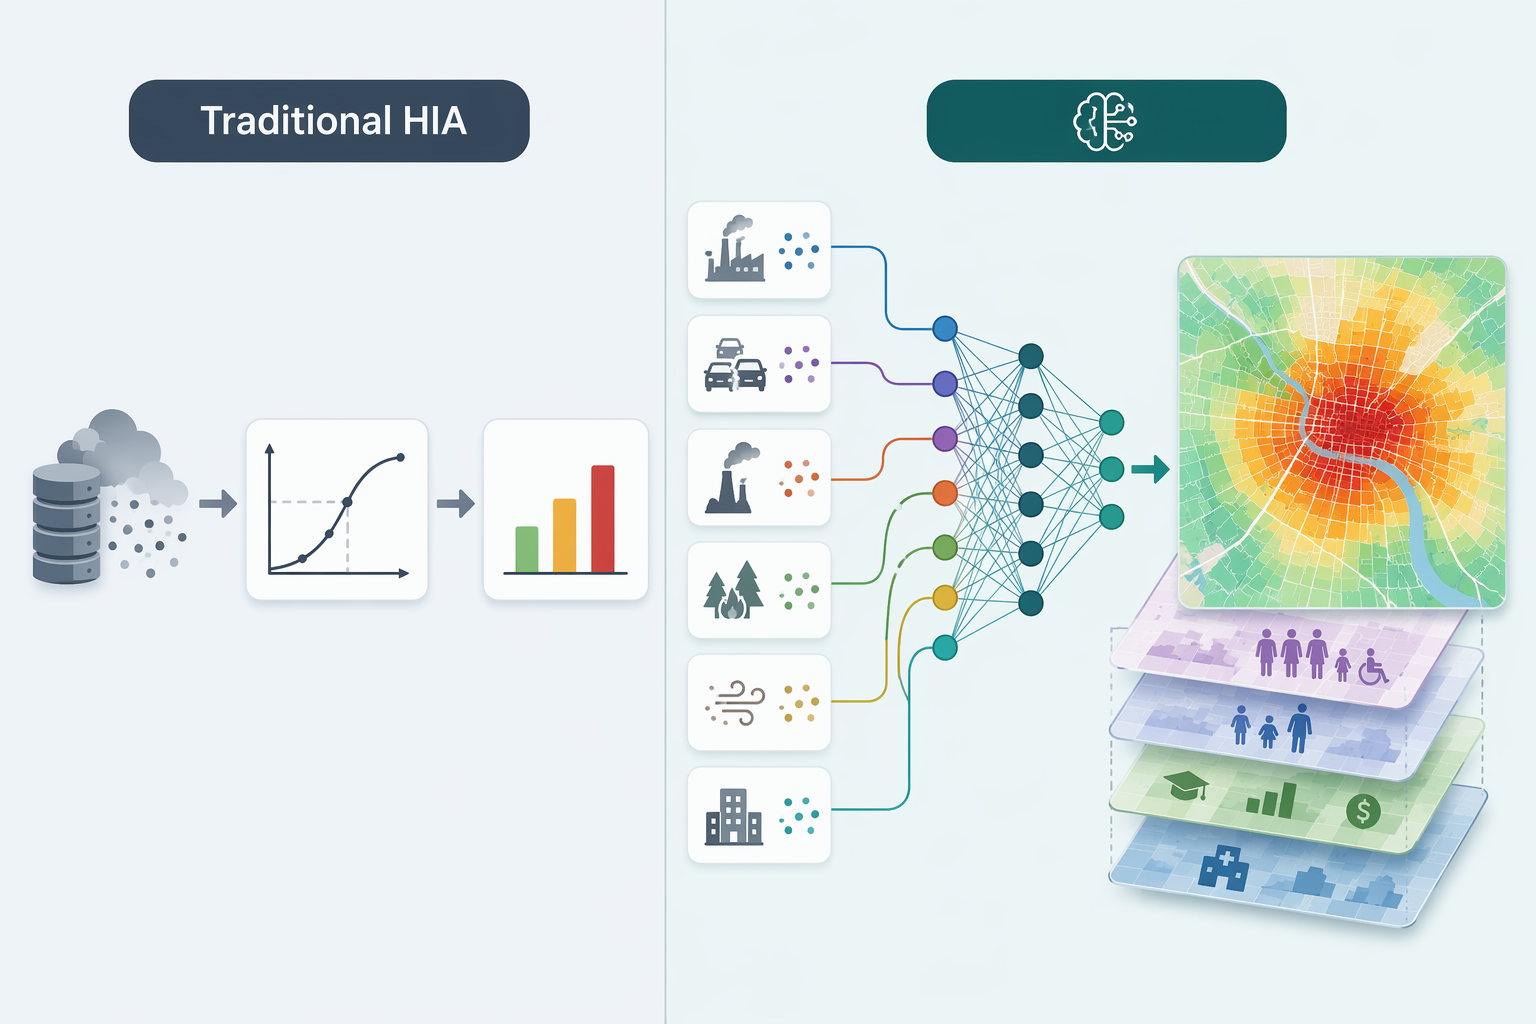
AI approaches can model nonlinearities, interactions, temporal patterns, and spatial heterogeneity more flexibly. That flexibility is valuable when pollutants cluster, weather modifies exposure, and neighborhood vulnerability changes the expected health burden. It is also where the clinical inference can become opaque. If the entire path from sensor input to mortality or admission risk is buried inside a model, a high performance statistic may be the only visible credential.
The more defensible compromise is often hybrid: use AI to estimate fine-grained exposure patterns, then connect those estimates to established concentration-response relationships where the clinical or population-health inference is already better characterized. This does not solve every problem. It still depends on valid exposure estimates, appropriate population baselines, and careful uncertainty handling. But it keeps the health-risk step partly anchored in epidemiologic evidence rather than asking the reader to trust a black-box translation from pollution signal to clinical outcome.
Vulnerability Layers Make The Map Clinically More Relevant
A citywide exposure forecast is useful, but it is rarely enough. The same PM2.5 or NO2 pattern can produce different expected burdens depending on who lives in the affected area, baseline disease prevalence, age distribution, housing conditions, occupational exposure, and access to care. Reviews of AI-based air pollution risk assessment describe frameworks that layer age, comorbidities, and socioeconomic status onto exposure estimates to support neighborhood-level health risk stratification.[3][4]
This is one of the places where AI can add practical value without overclaiming clinical precision. A public health team does not need the model to say that one named patient will visit the emergency department next week. It may need to know that several neighborhoods combine higher predicted exposure with older residents, higher respiratory vulnerability, and fewer buffers against delayed care. That information can change outreach timing, surveillance priorities, and the way limited mitigation resources are discussed.
The equity risk runs in the opposite direction as well. If personalized air-pollution alerts reach affluent urban residents first, the people with the best apps and devices may receive more protective information while communities with higher exposure burdens remain mapped mainly as aggregate risk zones. A vulnerability layer should not become a decorative overlay; it should affect how the output is used and who is expected to benefit.
The Validation Gap Is The Central Clinical Issue
The literature is growing quickly, but growth is not the same as clinical readiness. A bibliometric analysis found that research on AI in air pollution surged after 2017, with China (N=524) and the United States (N=455) dominating the literature, and PM2.5 appearing as the most studied pollutant in 53 of 83 reviewed studies.[5] That pattern shows momentum and concentration. It also signals a generalizability problem for underrepresented regions, rural settings, and places where monitoring networks and health records are thinner.
The more important limitation is the kind of validation being performed. Reviews of AI-based health risk assessment describe a field still dominated by retrospective or single-city studies, with prospective multi-site validation against actual hospital admission records remaining rare.[3] Many systems are evaluated on historical data, simulated scenarios, or synthetic data rather than live clinical outcomes. That can be acceptable for method development, but it should be labeled as such.
Retrospective fit can answer whether a model found patterns in past data. It cannot, by itself, answer whether a public health department should redeploy staff, whether a hospital should adjust respiratory capacity, or whether a clinician should alter care for an individual patient. Those decisions require evidence that the model remains calibrated when the weather changes, emissions shift, coding practices evolve, and care-seeking behavior differs from the training period.
No randomized controlled trials were identified in the supplied evidence base showing that AI-based air pollution health-risk tools improve patient outcomes compared with standard care. That absence does not make the tools useless. It does mean claims about routine clinical decision support should stay modest until prospective implementation studies or outcome trials are available.
What A Stronger Validation Package Would Show
- External testing across multiple cities or regions, including settings not used in model development
- Prospective comparison with actual hospital admissions, exacerbations, mortality records, or other prespecified health endpoints
- Calibration reporting for vulnerable subgroups, not only overall discrimination or fit
- Uncertainty estimates that remain visible in maps, alerts, and dashboards
- Evidence that the output changes decisions in a beneficial way rather than merely predicting a burden no one can act on
Interpretability Helps Only If It Is Used To Interrogate The Model
SHAP and LIME are commonly used in AI air pollution and health-risk studies to explain which variables contributed to model outputs, but reviews note that interpretability methods are not applied consistently across studies.[3] The distinction matters. An explanation plot added after model development is not the same as a transparent validation process.
For a public health user, interpretability should help answer concrete questions. Is the model driven mainly by PM2.5, temperature, seasonality, traffic proxies, or lagged admissions? Does it behave differently in lower-income neighborhoods? Does a comorbidity variable improve prediction, or does it act as a proxy for healthcare access? Are extreme-risk zones explained by real exposure patterns, sparse monitoring, or a data artifact?
Clinical users need similar discipline. If a model flags elevated respiratory risk after a pollution episode, an explanation should clarify whether the signal comes from exposure intensity, patient vulnerability, meteorology, prior utilization, or a mixture of these. Without that, the alert may be hard to audit and easy to overtrust.
Population-Level Use Is Closer Than Individual Clinical Decision Support
The current evidence supports a cautious hierarchy of use. AI-based exposure and risk models are most credible today for research planning, environmental surveillance, neighborhood risk stratification, and public health preparedness. These uses can tolerate some uncertainty because they support planning and prioritization rather than direct diagnosis or treatment.
A health department might use a validated model to identify neighborhoods where predicted pollutant levels and vulnerability indicators overlap, then coordinate outreach with clinics, schools, or community organizations. A hospital system might study whether forecasted pollution patterns correlate with respiratory demand and whether that signal improves staffing or messaging. A research team might use high-resolution exposure estimates to refine cohort analyses or target recruitment for environmental health studies.
Individual clinical decision support is a different proposition. Before a tool recommends changing an asthma action plan, prioritizing one patient for outreach, or altering medication decisions because of predicted pollution-related risk, it needs prospective validation in the relevant population and evidence that acting on the output improves outcomes. It also needs a workflow that defines who receives the alert, who reviews it, what action is expected, and who is responsible if the prediction is wrong.
The field is therefore not stuck at air quality dashboards, but it is not yet ready for broad bedside deployment. AI can make environmental exposure more spatially specific and can help translate that exposure into population-level health-risk intelligence. The strongest claims are still those that keep the health inference visible, test predictions against real outcomes, and reserve individual clinical use for settings where prospective evidence has caught up with model performance.
References
- Machine learning-driven framework for realtime air quality assessment and predictive environmental health risk mapping. Nature Scientific Reports.
- Scalable AI-driven air quality forecasting and classification for public health applications. Springer.
- AI Assessment of Health Risk Based on Air Pollution: An Epidemiological Review. Journal of Environmental Engineering and AI Assessment.
- AI-assisted air quality monitoring for smart city management. PMC.
- Applications of artificial intelligence in the field of air pollution: A bibliometric analysis. PMC.
Comments
Join the discussion with an anonymous comment.