
The important handoff is not the moment a neural network produces a cleaner pollution map. It is the next step, when that exposure surface is passed into a health impact assessment model and becomes an estimate of premature deaths, years of life lost, hospital admissions, chronic bronchitis, or disease-specific mortality. That is where a technical gain in exposure assignment either becomes clinically and policy relevant, or remains a better-looking map.
Traditional health impact assessment has often started with fixed monitors, regulatory networks, land-use regression, chemical transport models, or interpolation. Those methods can be defensible, especially where monitoring is dense and the question is broad. But they leave familiar problems: sparse spatial coverage, weak capture of local gradients, coarse temporal resolution, and exposure misclassification when people live far from monitors or near source mixtures that regional averages smooth away.
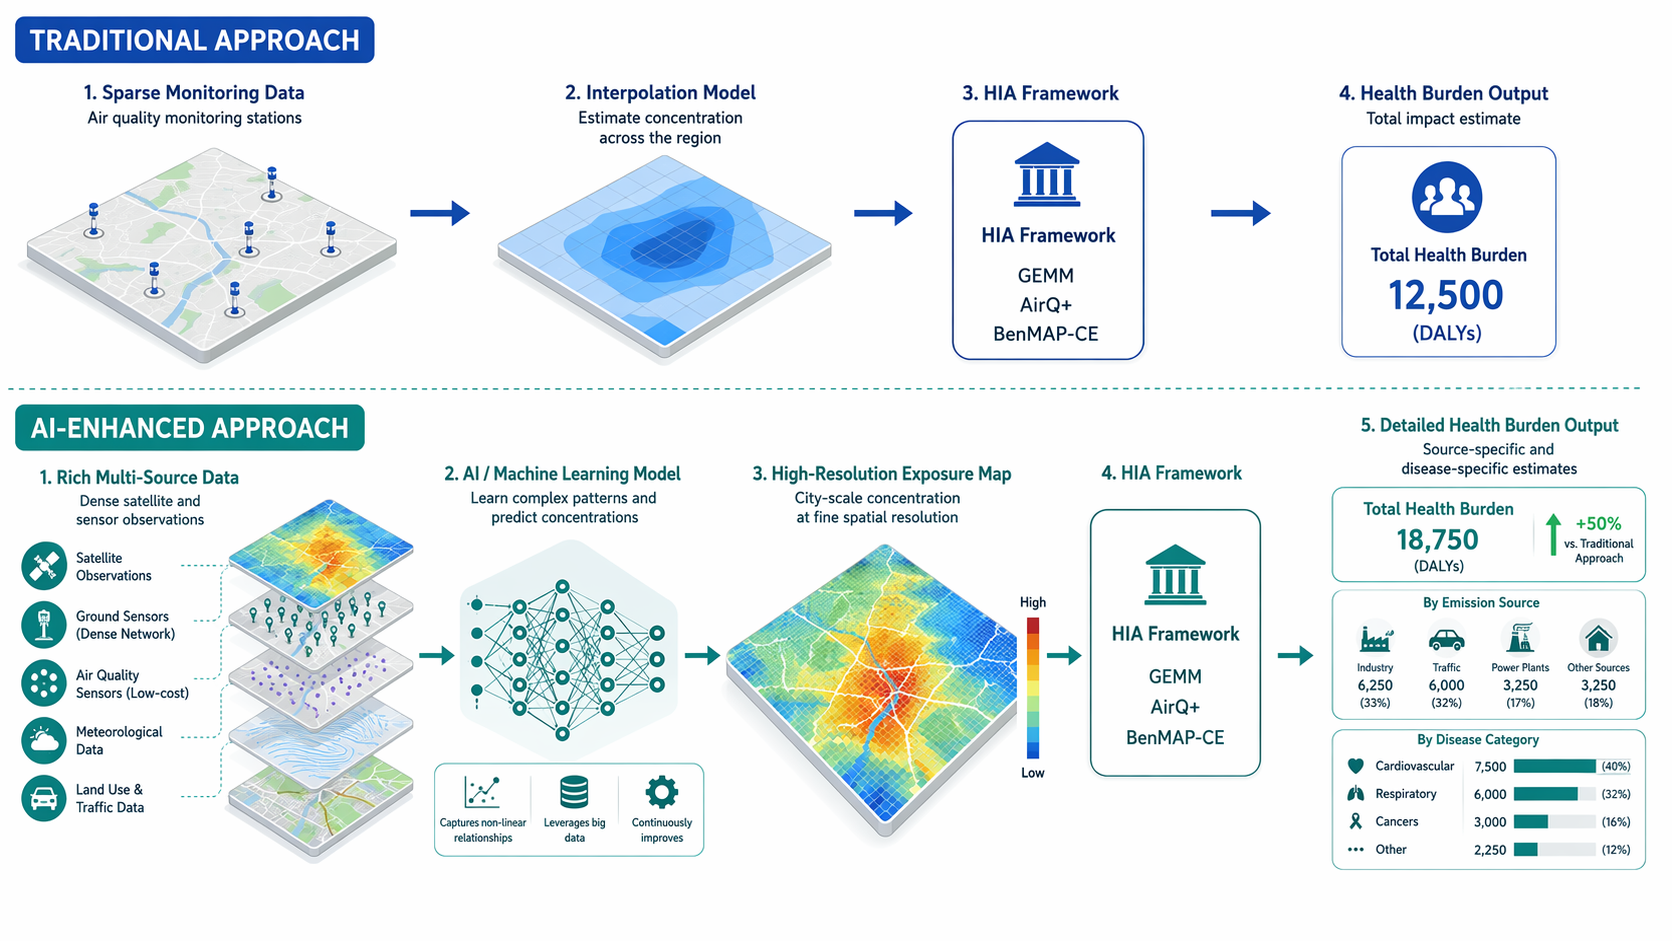
Machine learning changes that first input layer. Random forests, neural networks, long short-term memory models, hybrid satellite-ground models, and related approaches can combine monitor data with satellite retrievals, meteorology, land-use variables, emissions indicators, traffic, and temporal patterns. The exposure estimate that enters GEMM, AirQ+, BenMAP-CE, or a cohort model can therefore be higher-resolution, more complete, and more source-aware than the estimate produced by monitor-only assignment. The health question is whether that improvement changes the burden estimate in a way that can be interpreted and acted on.
The Evidence Base Is Broad, But Narrower Than It First Appears
The broadest recent map is a 2026 PRISMA-guided review of 83 studies on artificial intelligence, air pollution, and epidemiological health assessment. Its value is not that every model in it is ready for policy translation. Its value is that it shows where the field has actually accumulated evidence: overwhelmingly around PM2.5, with 53 of the 83 studies focused on that pollutant, and with hybrid AI models generally outperforming traditional statistical approaches in prediction tasks.[1]
That PM2.5 concentration matters. Fine particulate matter is already the pollutant for which many burden frameworks have mature concentration-response functions. If AI improves PM2.5 exposure assignment, it fits naturally into existing health impact assessment machinery. The same cannot yet be said with equal confidence for nitrogen dioxide, ozone, volatile organic compounds, black carbon, ultrafine particles, or source mixtures in places where exposure and health data remain thin.
The performance results are still notable. The 2026 review reports an ANN-MLP model with a testing R² of 0.99182 for respiratory hospital admission prediction.[1] A separate 2025 systematic review of 65 Q1 articles reported random forest accuracy of 98.2% and LSTM R² values of 0.995 to 0.998 across four urban stations, supporting the narrower claim that AI models can substantially improve air quality prediction under some monitored urban conditions.[2]
Those numbers should be read as model-performance evidence, not as automatic evidence of better causal inference. A high R² can reduce exposure measurement error; it does not by itself remove confounding, repair selection bias, validate a concentration-response function in a new population, or prove that an intervention on a source will produce the modeled health gain. In health impact assessment, better exposure assignment is necessary but not sufficient.
Where AI Enters the Health Impact Assessment Workflow
Most AI-enabled air pollution health assessments still depend on established epidemiological logic. A model estimates exposure; an HIA framework applies a concentration-response relationship; the output is an attributable burden under a specified counterfactual. The AI component usually does not replace the health impact model. It changes what the health impact model sees.
| Integration pattern | What AI changes | What the HIA framework still decides | Main interpretive risk |
|---|---|---|---|
| Drop-in exposure replacement | Predicted pollutant concentrations replace or supplement monitor/interpolation inputs | Baseline health rates, counterfactual concentration, concentration-response function, attributable burden calculation | Treating improved prediction as if it validates the health risk function |
| High-resolution burden mapping | Exposure is estimated at finer spatial or temporal scale | Which population is counted, which endpoint is modeled, and how uncertainty is propagated | Overstating local precision where health or population data are coarse |
| Source-specific assessment | Pollutant mass is decomposed by source or source-related fraction | How source-specific exposure relates to disease risk and which intervention scenario is modeled | Inferring source causality from exposure attribution alone |
| Disease-specific prediction | Exposure features are linked to morbidity or mortality endpoints in cohort or clinical models | Whether the endpoint definition, covariates, and follow-up support interpretation | Blurring prediction, association, and causation |
The first two patterns are shallow integration. They can still be useful. If AirQ+ receives a better PM2.5 surface for a city with poor monitor coverage, its attributable mortality or morbidity estimates may be less dependent on a small number of fixed stations. If BenMAP-CE receives finer exposure estimates by census tract, the distribution of benefits across neighborhoods may look different from a citywide average. The HIA calculation, however, remains largely the same.
The more consequential shift is deeper integration: source-specific or disease-specific modeling that changes the target of inference. Instead of asking only how many deaths are attributable to ambient PM2.5, the assessment can begin to ask how much risk is associated with PM2.5 from oil combustion, coal or biomass combustion, traffic-related mixtures, or other sources. That is closer to the way public health agencies make decisions, because interventions are aimed at sources, not at an undifferentiated concentration field.
What Changes When the Exposure Surface Improves
A health impact assessment is sensitive to inputs that are often treated as technical details. Change the exposure assigned to older adults in a high-density neighborhood, and the attributable deaths may change. Improve daily exposure estimates during pollution episodes, and short-term morbidity estimates may move. Separate a regional background component from a local combustion source, and the policy scenario becomes more specific.
For GEMM-style mortality estimation, the exposure input is translated through a risk function into deaths attributable to PM2.5 under a counterfactual concentration. In the evidence summarized in the 2026 review, GEMM applications using machine-learning-generated pollutant inputs estimated approximately 10.2 million fossil-fuel-attributable PM2.5 deaths globally in 2012 and approximately 8.7 million in 2018.[1] These figures are not simply air quality metrics; they are modeled health burdens, dependent on exposure surfaces, population data, baseline mortality, and the risk model.
That distinction is important for interpretation. If an AI model revises PM2.5 upward in densely populated areas and downward in sparsely populated areas, the average concentration may change modestly while the estimated disease burden changes substantially. Health impact assessment is population-weighted by design. A more accurate map can matter most when it corrects exposure where vulnerable or numerous populations actually live.
The same logic applies locally. WHO’s AirQ+ is designed to estimate attributable health impacts from air pollution using pollutant concentrations, population data, baseline incidence or mortality, and exposure-response functions.[4] In examples cited in the recent HIA literature, AirQ+ applications produced an attributable proportion of 25.64% for all-cause mortality in Kinshasa and 78.4% for chronic bronchitis in Agra.[4] These are policy-facing numbers because they translate exposure into a share of health burden, but they remain only as credible as the exposure data, local baseline rates, and transferability of the risk functions supporting them.
This is where AI can help without doing everything. It can reduce the exposure uncertainty that comes from sparse monitors or coarse spatial assignment. It cannot decide whether the counterfactual concentration is clinically meaningful, whether a global risk function is appropriate for a local population, or whether a modeled attributable fraction will survive political and budgetary scrutiny.
The Strongest Clinical Anchor Is Source-Specific PM2.5
The Mount Sinai work reported in NEJM Evidence is important because it moves the discussion beyond better PM2.5 prediction. Using machine-learning exposure models in a cohort of more than 65 million U.S. individuals from 2000 through 2016, the study linked source-specific PM2.5 fractions to atherosclerotic cardiovascular disease mortality.[3]
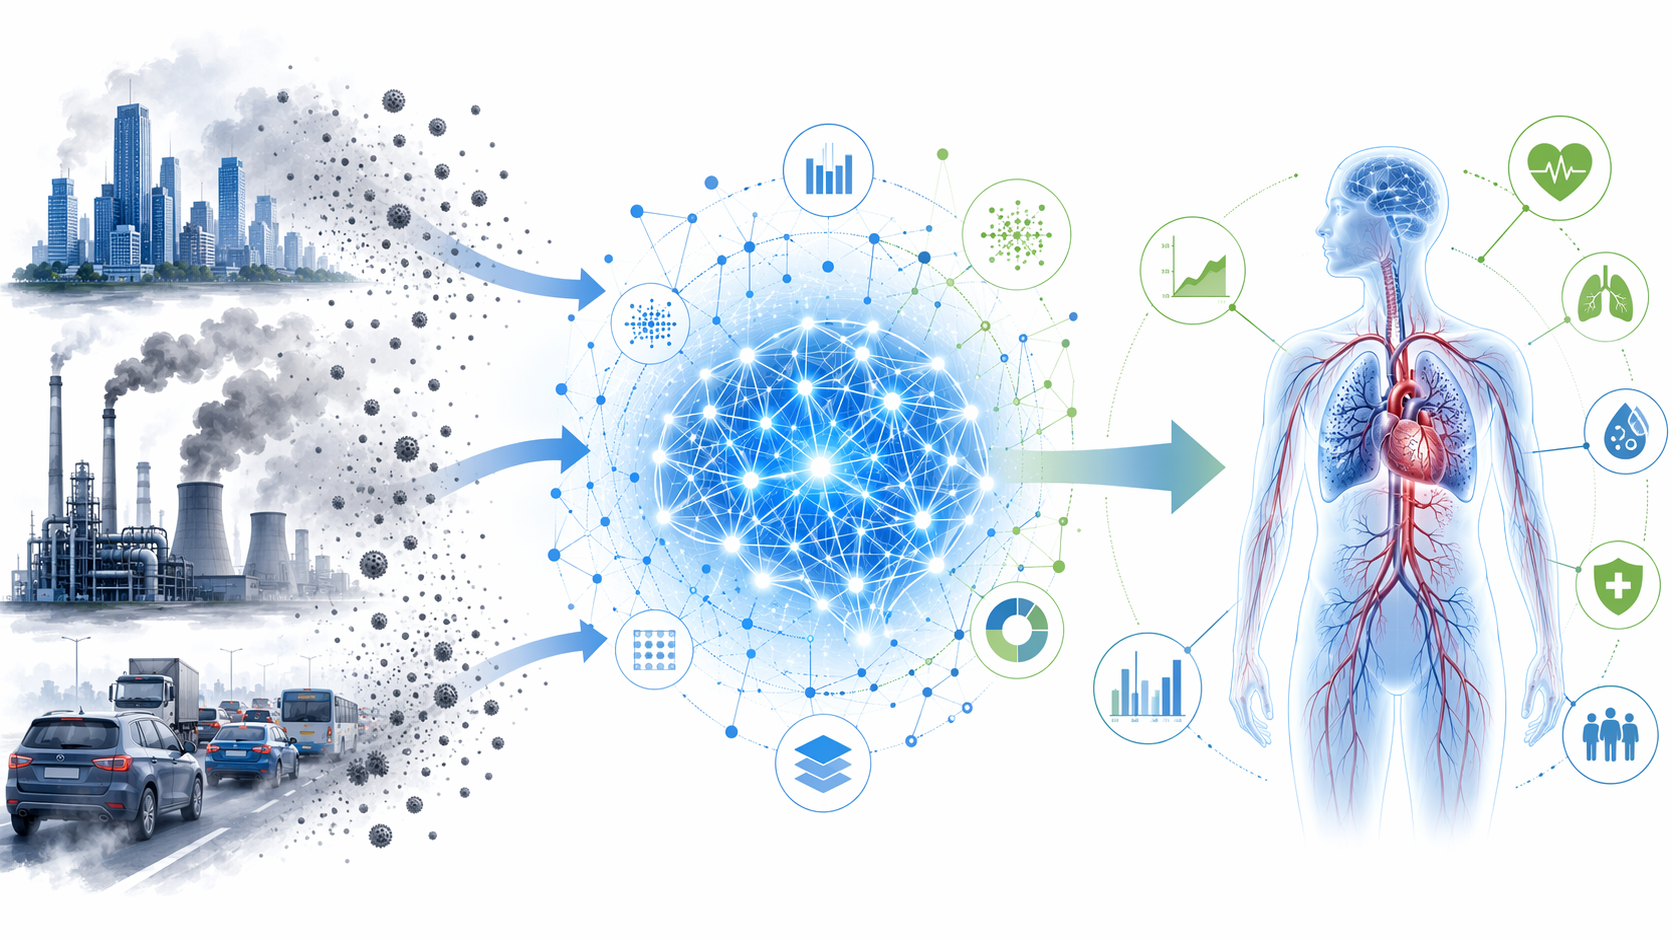
The reported association was not uniform across all particles. PM2.5 from oil combustion and from coal or biomass was associated with a 4% to 6% increase in ASCVD mortality risk per unit increase, and the elevated risk persisted even below federal air quality standards.[3] The below-standard finding is not a license to turn this into a threshold-policy manifesto. It is a methodological warning: regulatory compliance categories may be too blunt for estimating disease burden, especially when source-specific fractions carry different risks.
The study’s scale gives it weight, but the design still deserves careful language. Machine learning made source-specific exposure assignment possible at very large scale; it did not make the exposure randomized. The result is best read as strong observational evidence that source-resolved PM2.5 estimates can reveal cardiovascular risk patterns that bulk PM2.5 metrics may obscure. That is already enough to matter for health impact assessment.
For a policy analyst, the difference is practical. A conventional burden estimate may say that PM2.5 reduction would prevent a modeled number of ASCVD deaths. A source-specific estimate can suggest which combustion-related fractions are carrying more of the modeled risk. The second statement is still uncertain, but it is closer to an intervention scenario: fuel combustion, industrial activity, power generation, transport, or biomass burning can be regulated, substituted, or monitored differently.
Better Prediction Does Not Automatically Mean Better Health Inference
The clinical and epidemiological literature has been appropriately interested in AI’s ability to combine high-dimensional environmental data with health outcomes, but it has also emphasized familiar cautions: model transparency, transportability, confounding, exposure misclassification, and the difference between prediction and explanation.[5] Those cautions are not formalities. They determine whether an AI-enhanced HIA estimate can be compared across cities, defended in a regulatory setting, or used to prioritize interventions.
Transportability is the first pressure point. Many high-performing models are trained in places with monitors, satellite coverage, emissions inventories, and health records. That is exactly why they perform well. It is also why applying them to rural regions, rapidly changing peri-urban areas, or countries with sparse ground monitoring can be hazardous. A model may interpolate beautifully inside the support of its data and behave poorly where the source mix, housing stock, meteorology, or health system differs.
Pollutant diversity is the second. The current AI-in-HIA evidence base is largely a PM2.5 evidence base. That is not a minor limitation, because respiratory and cardiovascular risks are shaped by mixtures, gases, particle composition, and time-activity patterns. If the literature remains centered on PM2.5 mass, health impact assessment may become more precise for the pollutant it already knows best while leaving other exposure questions underdeveloped.
Uncertainty propagation is the third. A polished AI exposure surface can make uncertainty less visible to nontechnical readers. HIA outputs should preserve uncertainty from exposure prediction, baseline disease rates, concentration-response functions, population projections, and counterfactual assumptions. Otherwise, a modeled reduction in attributable deaths may appear more certain than the evidence supports.
What an Actionable AI-Enhanced HIA Should Show
The most useful studies are explicit about where AI sits in the workflow. They do not merely report that a model predicted air pollution well. They state whether the model changed exposure assignment, source attribution, disease-risk estimation, or scenario analysis. They identify the health endpoint: all-cause mortality, ASCVD mortality, respiratory admissions, chronic bronchitis, years of life lost, or another outcome. They state whether the output is an association, an attributable burden estimate, or a modeled policy scenario.
- Exposure input: pollutant, averaging period, spatial resolution, source fraction, and validation setting.
- Health model: GEMM, AirQ+, BenMAP-CE, cohort model, or another framework.
- Endpoint: mortality, morbidity, disease-specific mortality, hospital admission, chronic disease incidence, or years of life lost.
- Counterfactual: guideline level, regulatory standard, minimum-risk concentration, source-removal scenario, or other comparison.
- Uncertainty: exposure model error, epidemiological uncertainty, baseline health-rate uncertainty, and limits of geographic transfer.
A study that provides those elements gives clinicians and policy analysts something to evaluate. A study that stops at model accuracy asks the reader to assume the health relevance. That assumption is becoming less acceptable as AI models move from environmental prediction into burden estimation.
A Narrower, More Defensible Judgment
AI is already improving air quality health impact assessment where the conditions are favorable: PM2.5 is the pollutant, monitoring and auxiliary data are sufficient, exposure models are validated, and the HIA framework is transparent about its assumptions. In that setting, machine learning can produce more precise population exposure estimates, support finer burden mapping, and make source-specific health risks visible enough to inform intervention choices.
The strongest current evidence supports precision and policy relevance more than causal certainty. The 83-study review shows a field with real methodological breadth but a heavy PM2.5 center. The Mount Sinai cohort shows why source-specific exposure modeling matters clinically, especially for ASCVD mortality. GEMM and AirQ+ examples show how AI-enhanced exposure inputs can become deaths, attributable proportions, or morbidity estimates rather than pollution maps alone.
That is enough to change serious HIA practice, but not enough to declare a general AI transformation of environmental health. The next standard is replication across regions, pollutants, source mixtures, and health endpoints, with uncertainty carried through to the final burden estimate. Better exposure models are a meaningful advance. They are not a substitute for epidemiological judgment.
References
- The 83-study epidemiological review, Environmental Sciences Europe, 2026.
- The 2025 systematic review of 65 Q1 articles, ScienceDirect, 2025.
- New study using machine learning links air pollution exposure to increased risk for atherosclerotic cardiovascular disease, Mount Sinai Exposomics.
- AirQ+: software tool for health risk assessment of air pollution, World Health Organization.
- Opportunities for artificial intelligence in air pollution and health research, Journal of Allergy and Clinical Immunology, 2024.
Comments
Join the discussion with an anonymous comment.