
The practical question in AI models for predicting wildfire smoke duration and health effects is not which architecture sounds most advanced. It is whether the model can estimate smoke-related PM2.5 at the spatial and temporal scale needed for a health study, and whether that exposure estimate can be carried into mortality, emergency department, or morbidity analysis without hiding its limits.
That distinction matters because the field is now doing several different jobs under one label. Some models reconstruct daily or hourly PM2.5 concentrations after smoke events. Some predict pollutant time series near a monitoring site. Some aim at operational smoke forecasts days or weeks ahead. Others use smoke exposure estimates inside climate-linked mortality projections. A high R² from one task does not automatically make a model suitable for another.
The need for better exposure models is not abstract. A Stanford-led analysis reported a 27-fold increase in the U.S. population exposed to unhealthy wildfire smoke days over a decade, along with an 11,000-fold increase in extreme exposures above 200 μg/m³. The study used satellite and ground monitoring data at 10 km resolution to quantify how wildfire smoke has begun to erode earlier air quality gains.[1]

The model task comes before the model name
Wildfire smoke health research usually needs two linked products. The first is an exposure surface: where smoke PM2.5 was, how concentrated it was, and how long it persisted. The second is an exposure-response estimate: how those concentrations relate to outcomes such as all-cause mortality, respiratory emergency department visits, or cardiovascular events.
The exposure surface is where machine learning has made the clearest technical contribution. Satellite observations see broad spatial patterns but can miss ground-level concentrations. Ground monitors measure local air quality but are sparse. Meteorology explains movement and dilution. Dispersion models such as HYSPLIT add plume-transport information. Machine learning models become useful when they combine these imperfect signals into estimates that can be mapped across neighborhoods and days.
The health linkage is harder to judge from model performance alone. An exposure model can have strong validation statistics and still be mismatched to a health question if it predicts the wrong pollutant, averages over the wrong time window, or performs best in a geography unlike the study population. For risk assessment, the relevant question is not simply whether the model predicts PM2.5 well, but whether it predicts the PM2.5 variation that matters for the outcome being analyzed.
How the main model families compare
The strongest evidence for health-oriented wildfire smoke modeling comes from multi-source models that combine satellite, monitoring, meteorological, and plume-related information. These models are not interchangeable. Their differences are most meaningful when read against pollutant target, resolution, forecast horizon, and validation setting.
| Model approach | Main task | Inputs noted in available evidence | Resolution or horizon | Reported performance or status | Best fit |
|---|---|---|---|---|---|
| Machine learning exposure reconstruction | Estimate wildfire smoke exposure trends | Satellite and ground monitoring data | 10 km resolution | Used to quantify 27-fold increase in U.S. population exposed to unhealthy wildfire smoke days | Population exposure trend analysis |
| Ensemble deep learning with HYSPLIT-informed features | Estimate PM2.5 concentrations for health research | Multi-source predictors including HYSPLIT-modeled wildfire smoke dispersion | 1 km California PM2.5 estimates | R² = 0.87; RMSE = 2.29 μg/m³ | High-resolution retrospective exposure estimation |
| Stacked hybrid deep learning and gradient boosting | Predict related atmospheric pollutants | LightGBM, LSTM, GRU, BiLSTM, and Fire Exposure Index variables | Single-observatory time series in Calabria, Italy | R² > 0.98 for CO, CH₄, and CO₂ | Bounded pollutant time-series prediction, not general PM2.5 infrastructure |
| Climate-linked ensemble ML | Project future smoke mortality burden | Climate variation, wildfire smoke PM2.5, and empirically estimated dose-response mortality | U.S. projection to 2050 and 2025-2055 cumulative window | Projects 71,000 excess U.S. deaths per year by 2050 under high warming | Long-horizon burden estimation |
| Emerging sub-seasonal AI forecasting | Forecast wildfire conditions or smoke-relevant patterns | CIRES/NOAA system details not fully documented in available peer-reviewed materials | 35-45 day lead time reported from January 2026 AMS presentation | Emerging operational evidence | Planning context, pending stronger validation documentation |

High-resolution PM2.5 estimation: the USC California model
For epidemiologic use, the USC ensemble deep learning model is one of the most important examples because it moves the exposure estimate to 1 km resolution. Li et al. reported an autoencoder full residual deep network for California PM2.5 that incorporated HYSPLIT-modeled wildfire smoke dispersion as a predictive feature. The model achieved R² = 0.87 and RMSE = 2.29 μg/m³.[2]
The resolution is not a decorative detail. A 10 km grid can be informative for regional exposure trends, but it can smooth over differences between adjacent neighborhoods, valleys, or downwind communities. A 1 km surface is more useful when the health analysis depends on assigning exposure to residential location, linking repeated exposure days to administrative health records, or separating smoke episodes from background PM2.5 variation.
The California boundary should travel with the result. The model’s reported performance does not prove that the same architecture, trained the same way, would perform nationally or in regions with different terrain, fire regimes, monitor density, or aerosol mixtures. It does show that ensemble deep learning with plume-dispersion information can produce the kind of fine-grained exposure surface that health researchers have needed.
Stacked hybrids: impressive numbers, narrower evidence
Das et al. reported a stacked hybrid system combining LightGBM, LSTM, GRU, and BiLSTM components, along with a Fire Exposure Index built from distance from fire, wind alignment, burned area, and fire duration. The model achieved R² values above 0.98 for CO, CH₄, and CO₂ prediction.[3]
Those results deserve attention, but not the kind that turns them into a field-wide winner. The study used single-observatory data from Calabria, Italy, and the target pollutants were not PM2.5. In atmospheric time series, especially at one site, high apparent performance can partly reflect temporal autocorrelation. That does not make the model unimportant; it makes the validation setting central to interpretation.
For a health analyst studying wildfire smoke PM2.5 exposure, the Das et al. result is best read as evidence that stacked architectures can extract signal from fire, wind, and pollutant sequences. It is not, by itself, evidence that a stacked hybrid will outperform a California-trained 1 km PM2.5 model in assigning smoke exposure to Medicare beneficiaries or emergency department catchment areas.
Forecasting systems sit on a different evidentiary shelf
Forecasting models answer a different question from retrospective exposure models. A sub-seasonal system with a 35-45 day lead time could be valuable for emergency planning if it is reliable enough, but the available documentation comes from a January 2026 AMS presentation rather than a peer-reviewed validation record. That makes it relevant as an emerging operational direction, not equivalent evidence to peer-reviewed exposure and health-burden studies.
For research design, this distinction is straightforward. Use retrospective exposure models when the goal is to estimate observed exposure and link it to observed outcomes. Use forecasting systems when the question is preparedness, resource planning, or prospective risk warning. A model built to warn before a smoke season does not need to meet the same criteria as a model built to support a dose-response estimate, but it does need transparent validation against the decision horizon it claims to serve.
From exposure surfaces to health burden
The most consequential use of these models is not the map; it is what happens after the map is linked to people. Exposure estimates become health evidence only after they are joined to populations, time windows, and outcomes. That join is where smoke duration, not just peak concentration, becomes important.
The NBER Medicare analysis by Miller, Molitor, and Zou is a useful corrective to the idea that only spectacular smoke days matter. The authors found that wildfire smoke causes 10,070 premature deaths and 191,541 excess emergency department visits annually among Americans over 65. They also reported that PM2.5 increases up to 158% on smoke plume days, and that emergency department visits rise 0.7% within 3 days.[4]
The troubling part for risk assessment is the finding that per-unit health impact is largest at low pollution levels. Small smoke increments can produce disproportionate harm. That changes how a model should be judged: a model that performs well only during high-smoke episodes may still miss the exposure variation that matters for a large share of population burden.
This is also why wildfire smoke PM2.5 should not be casually merged into generic PM2.5. ISGlobal reported that standard epidemiological models may underestimate mortality risk from wildfire PM2.5 by 93% compared with other PM2.5 sources, and estimated 535 wildfire-attributable deaths per year in Europe.[5] If source-specific toxicity or exposure patterns differ, then an exposure model that separates wildfire smoke from background PM2.5 has more value than one that only predicts total particulate matter accurately.
Climate mortality projections answer a longer-horizon question
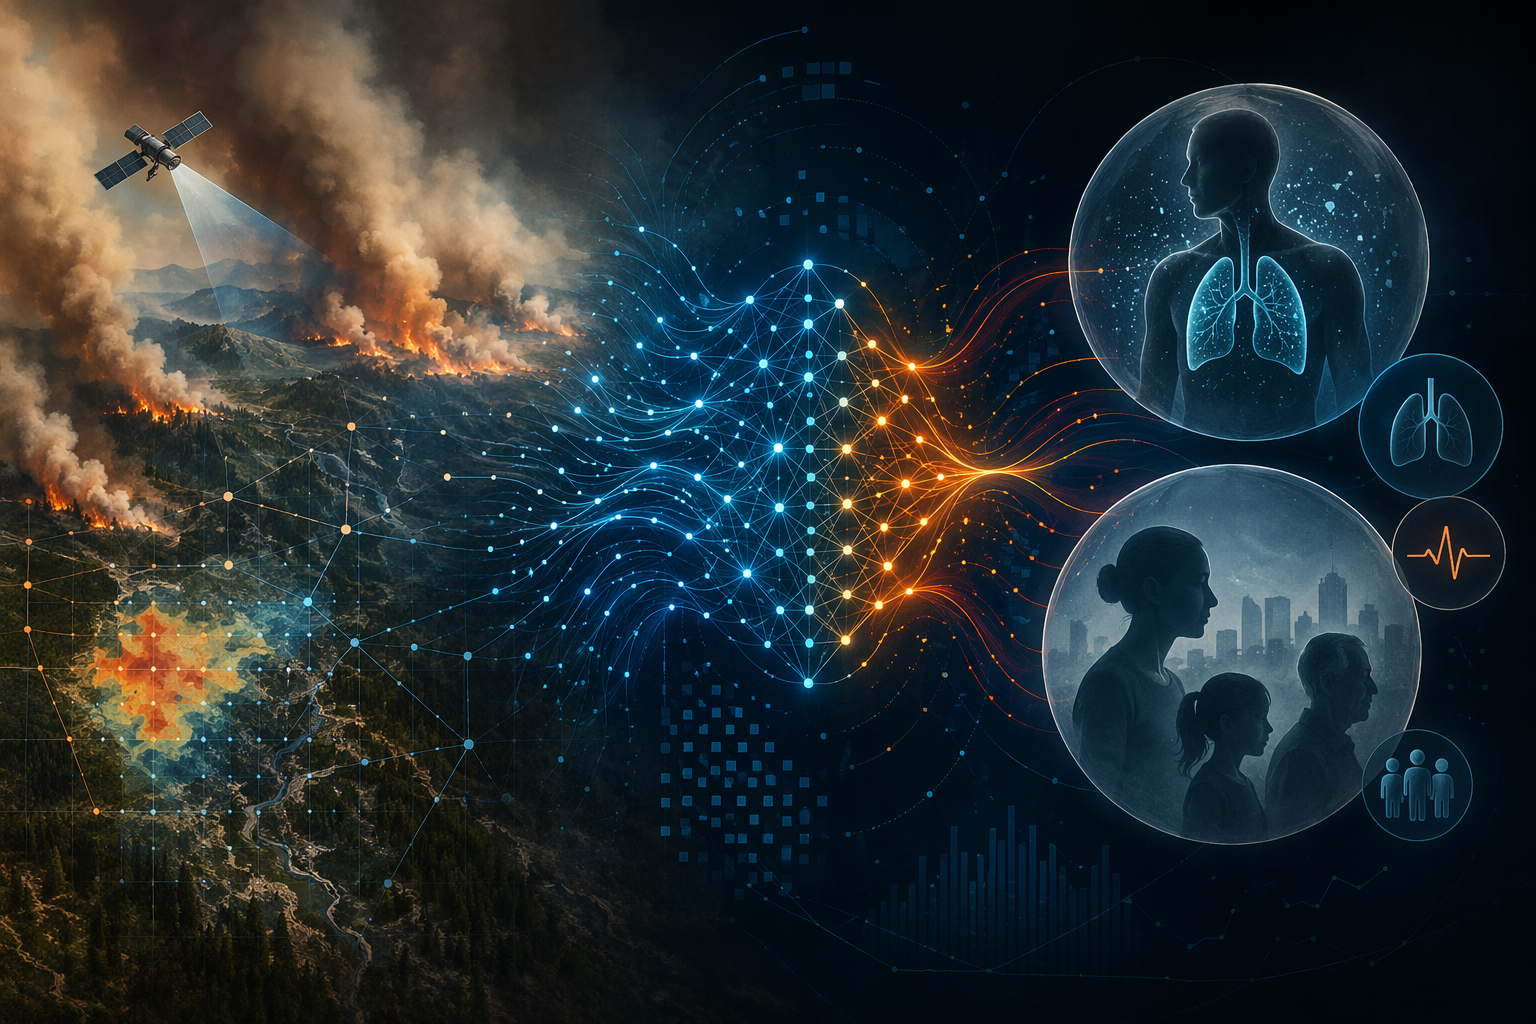
Qiu et al. extend the modeling chain from observed exposure into future burden. The Stony Brook and Stanford work used ensemble machine learning models linking climate variation to wildfire smoke PM2.5 and then to empirically estimated dose-response mortality. Under a high-warming scenario, the 2025 Nature study projects 71,000 excess U.S. deaths per year by 2050, a 73% increase over 2011-2020, with more than 700,000 cumulative deaths from 2025 through 2055 and $244 billion in annual damages.[6]
An earlier SIEPR working paper connected to the same research line projected 27,800 excess deaths per year.[7] The available materials do not fully reconcile that lower estimate with the later 71,000 figure. The responsible reading is that mortality projections are sensitive to methods, scenarios, and assumptions; they should not be treated like near-term smoke warnings or direct counts of observed deaths.
Climate Central’s 2025 analysis adds a broader burden estimate, reporting approximately 164,000 premature U.S. deaths from wildfire smoke from 2006 to 2020, with about 15,000 attributable to climate change. It also estimated 580 additional deaths per year in California, Oregon, and Washington alone.[8] This kind of analysis is useful context for scale, but it does not replace model-specific validation for a particular exposure or health-outcome study.
What to check before choosing a model
A practical comparison should start with the research question, then move to architecture. The same model family can be appropriate or inappropriate depending on how exposure will be assigned and what decision the analysis is meant to support.
- Pollutant target: confirm whether the model estimates wildfire smoke PM2.5, total PM2.5, or related gases such as CO, CH₄, and CO₂.
- Spatial resolution: match the grid to the health data; neighborhood-level exposure studies need finer surfaces than national trend summaries.
- Temporal window: distinguish hourly, daily, multi-day, seasonal, and 35-45 day forecasting horizons.
- Geography: do not assume a California-trained model, a Calabria observatory model, or a U.S. climate projection will transport without new validation.
- Input data: examine whether the model uses satellite observations, ground monitors, meteorology, plume modeling, fire characteristics, or a combination.
- Validation setting: read R² with the pollutant, resolution, location, and holdout strategy attached.
For high-resolution retrospective PM2.5 exposure estimation, ensemble and deep learning approaches trained on multi-source data currently have the strongest support. The Li et al. model is particularly relevant because it combines fine spatial resolution, PM2.5 targeting, and plume-informed predictors. For pollutant time-series prediction, stacked hybrids may be powerful, but the Das et al. evidence remains bounded by site, pollutant, and validation context. For mortality burden under climate change, ensemble ML belongs inside a larger causal chain that includes climate scenarios and dose-response assumptions.
The conditional conclusion is more useful than a ranking. If the study requires linking wildfire smoke PM2.5 to mortality, emergency department visits, or cardiovascular morbidity, favor models that separate smoke-related PM2.5 from background pollution, operate at the needed spatial and temporal resolution, and report validation in a comparable setting. If the task is planning rather than attribution, forecast horizon and operational reliability move higher in the hierarchy. No single architecture dominates across these uses.
References
- Wildfire smoke is unraveling decades of air quality gains, Stanford Doerr School of Sustainability, link
- Li et al. 2020, Environment International, link
- Das et al. 2026, Scientific Reports, link
- Health Consequences of Wildfire Smoke, NBER, link
- Beyond the fire: health effects of wildfire smoke, ISGlobal, link
- Study: Wildfire Smoke May Lead to Thousands More U.S. Deaths, Stony Brook Medicine, link
- The mortality burden of wildfire smoke under climate change, SIEPR, link
- Climate Change Worsens Wildfire Smoke, Climate Central, 2025, link
Comments
Join the discussion with an anonymous comment.