
A hazardous AQI alert is useful only up to the point where someone has to decide what to do with it. For a respiratory clinic, an emergency department operations lead, or a population health team, the operational question is not simply whether the air is bad. It is which neighborhoods are likely to see clinical demand, which patients are most exposed or physiologically vulnerable, and whether the signal arrives early enough to change outreach, staffing, or triage.
That is where AI monitoring becomes clinically interesting. Recent reviews report that machine learning models such as Random Forest, XGBoost, and LSTM can classify AQI levels, including hazardous conditions, with about 91–98% accuracy in the studied settings.[1][2] Those figures matter. They also do not settle the question. Classification accuracy tells a health system that the model can label air conditions; it does not tell the health system whether chronic respiratory patients will arrive in larger numbers, whether a high-risk census tract is being missed, or whether the model will hold up when local sensors fail, drift, or leave gaps.
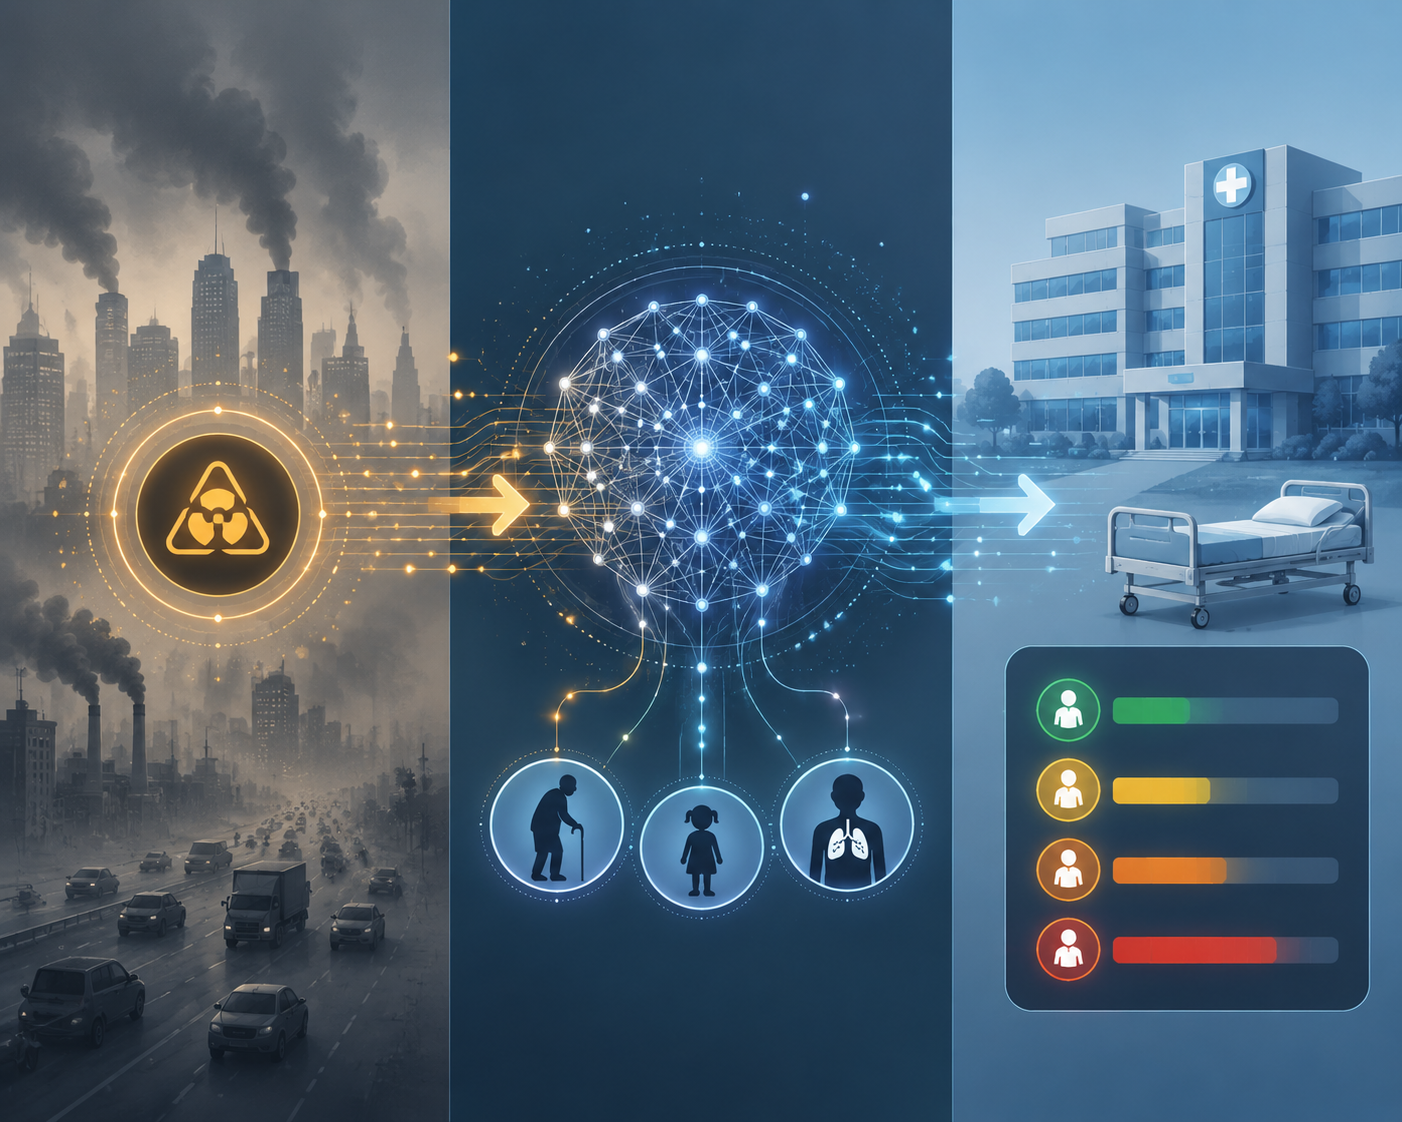
The more useful chain is longer: pollutant and AQI data are classified by AI models, combined with population density and vulnerability factors, translated into spatial Health Risk Index maps, and, where clinical data are available, connected to respiratory admissions or emergency department demand. The strongest systems are not just air monitors with better math. They are handoff systems.
From hazardous AQI classification to health risk
AQI classification is the first handoff. It turns sensor and pollutant data into a warning category that non-specialists can recognize. AI models can improve this step by learning nonlinear pollutant patterns, temporal changes, and local combinations that static thresholds may handle less flexibly. In the evidence base summarized by Patil and Agrawal and by the 2025 systematic review, that classification task is no longer the most fragile link in the chain, at least in controlled or study-defined environments.[1][2]
The next handoff is harder. A hazardous label says little about who is at near-term risk unless it is connected to where people are, who they are, and what clinical conditions they already carry. A dense business district, a neighborhood with older adults and children, and a rural community with few monitors may all be affected by poor air, but they create different operational problems. One may stress commuter exposure messaging. Another may call for proactive outreach to patients with asthma, COPD, or cardiovascular disease. The rural setting may simply have too little measurement density to justify confidence.
This distinction is also why international AQI translation cannot be treated as a formatting problem. “Hazardous” is not a universal category with identical thresholds across AQI systems such as the US EPA AQI, WHO-oriented guidance, and the European Air Quality Index. A model trained or evaluated under one jurisdiction’s index may not produce the same clinical trigger under another. For clinical operations, that means the alert threshold has to be mapped to the local AQI system before it is mapped to staffing or outreach decisions.[2]
What a Health Risk Index adds
The Health Risk Index approach in Rajesh et al. is important because it changes the output from an environmental status report into a spatial risk product. Their framework combines pollutant exceedance, population density, and demographic vulnerability factors, including older adults, children, and people with pre-existing respiratory or cardiovascular conditions, to produce risk maps updated every 5 minutes.[3]
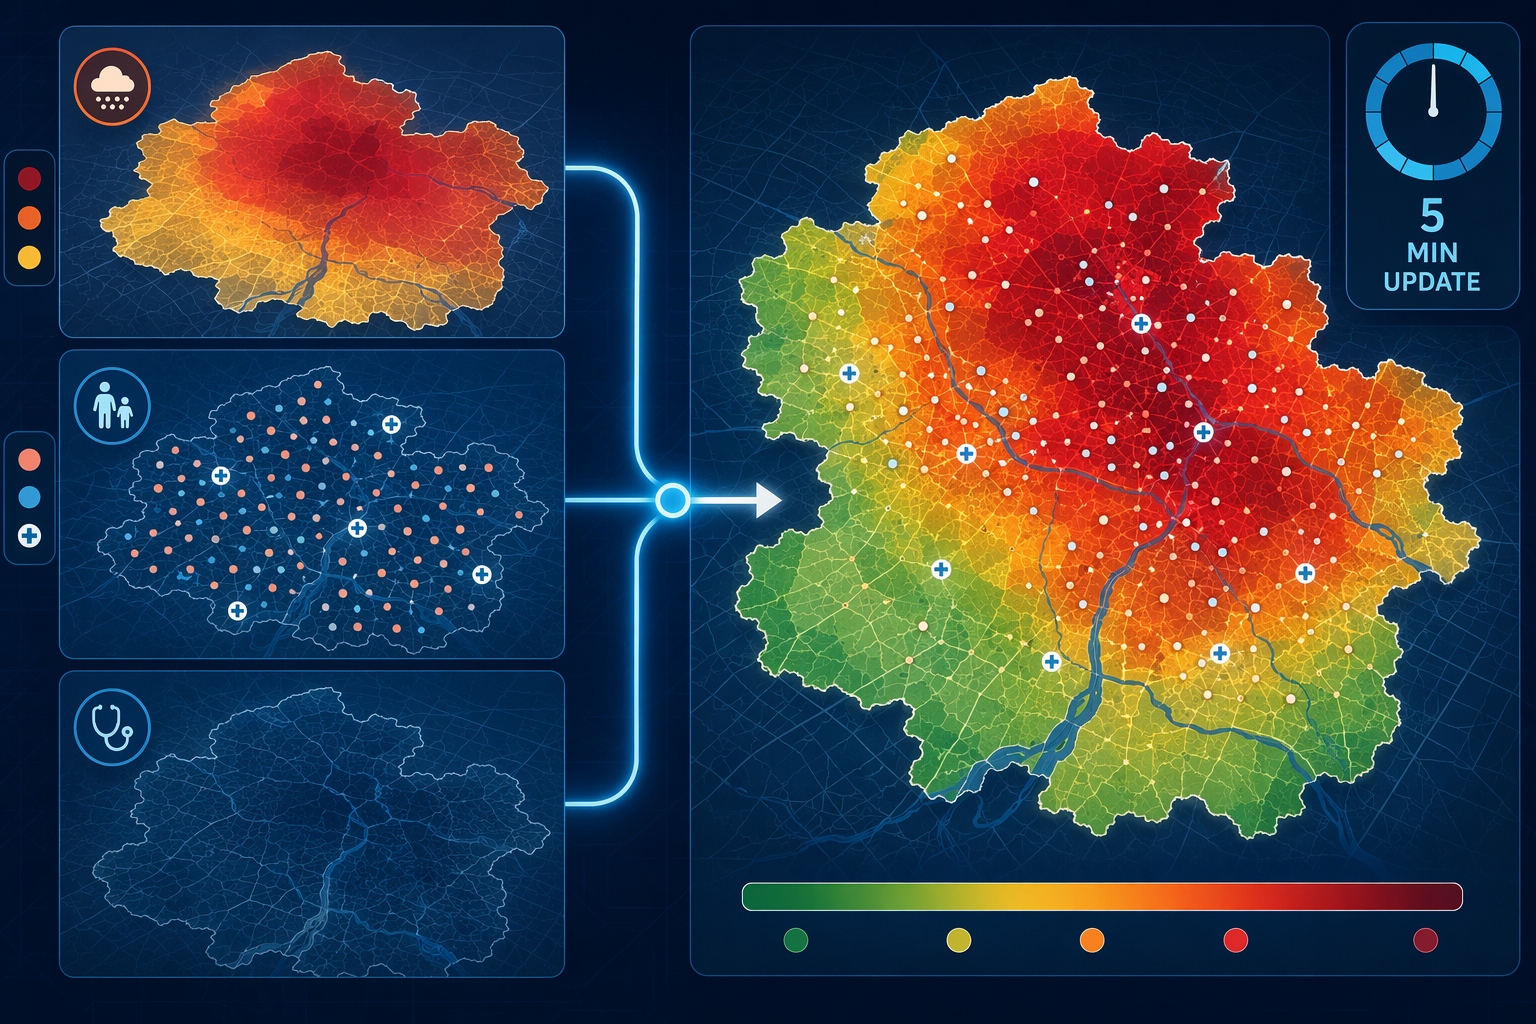
That update cycle is operationally meaningful. A daily map can support planning. A 5-minute map can support situational awareness during a pollution episode, especially if it shows that the highest pollutant readings and the highest vulnerability are not in the same place. The clinical value is not the color gradient itself; it is the ability to separate areas with high pollutant exposure from areas where exposure is more likely to become medical demand.
| Pipeline element | What it contributes | Why it matters clinically |
|---|---|---|
| Pollutant and AQI data | Detects and classifies air quality conditions | Identifies when an environmental hazard is present |
| AI classification model | Learns pollutant patterns and forecasts AQI category | Improves alerting beyond static dashboard review |
| Population density | Estimates how many people may be exposed | Helps prioritize areas where exposure could translate into volume |
| Vulnerability factors | Adds age and pre-existing respiratory or cardiovascular risk | Distinguishes general exposure from likely clinical susceptibility |
| Health Risk Index map | Combines hazard, exposure, and vulnerability spatially | Supports outreach, triage awareness, and resource positioning |
| Admissions or ED forecasting | Links environmental risk to expected care demand | Moves the system closer to staffing and capacity decisions |
The vulnerability layer deserves more scrutiny than it often receives. If demographic or disease-prevalence data are incomplete, delayed, or too coarse, the map can look precise while underrepresenting the people most likely to need help. Rural and underserved areas are especially exposed to this problem. Sparse sensors, thinner claims or registry data, and fewer nearby clinical facilities can all make an AI-generated risk map less reliable exactly where the margin for missed warning may be smaller.
Urban maps can create a false sense of readiness because they are visually dense and operationally familiar. They show blocks, clinics, roads, and gradients that invite action. A rural map with fewer sensors and less granular population data may not give the same confidence, but that does not mean the risk is lower. It may only mean the system has less evidence. For health systems covering both urban and rural populations, the absence of a red zone should not be read as the absence of risk unless the measurement network is strong enough to support that conclusion.
The clinical bridge: forecasting respiratory visits
The clearest clinical bridge in the available evidence comes from Peng et al., who used machine learning to forecast peak outpatient and emergency department visits for patients with chronic respiratory diseases. In that study, an ANN-MLP model achieved an R² of 0.99 for forecasting respiratory admissions during hazardous AQI events.[4] That result is qualitatively different from classifying the air. It connects environmental signals to care demand.
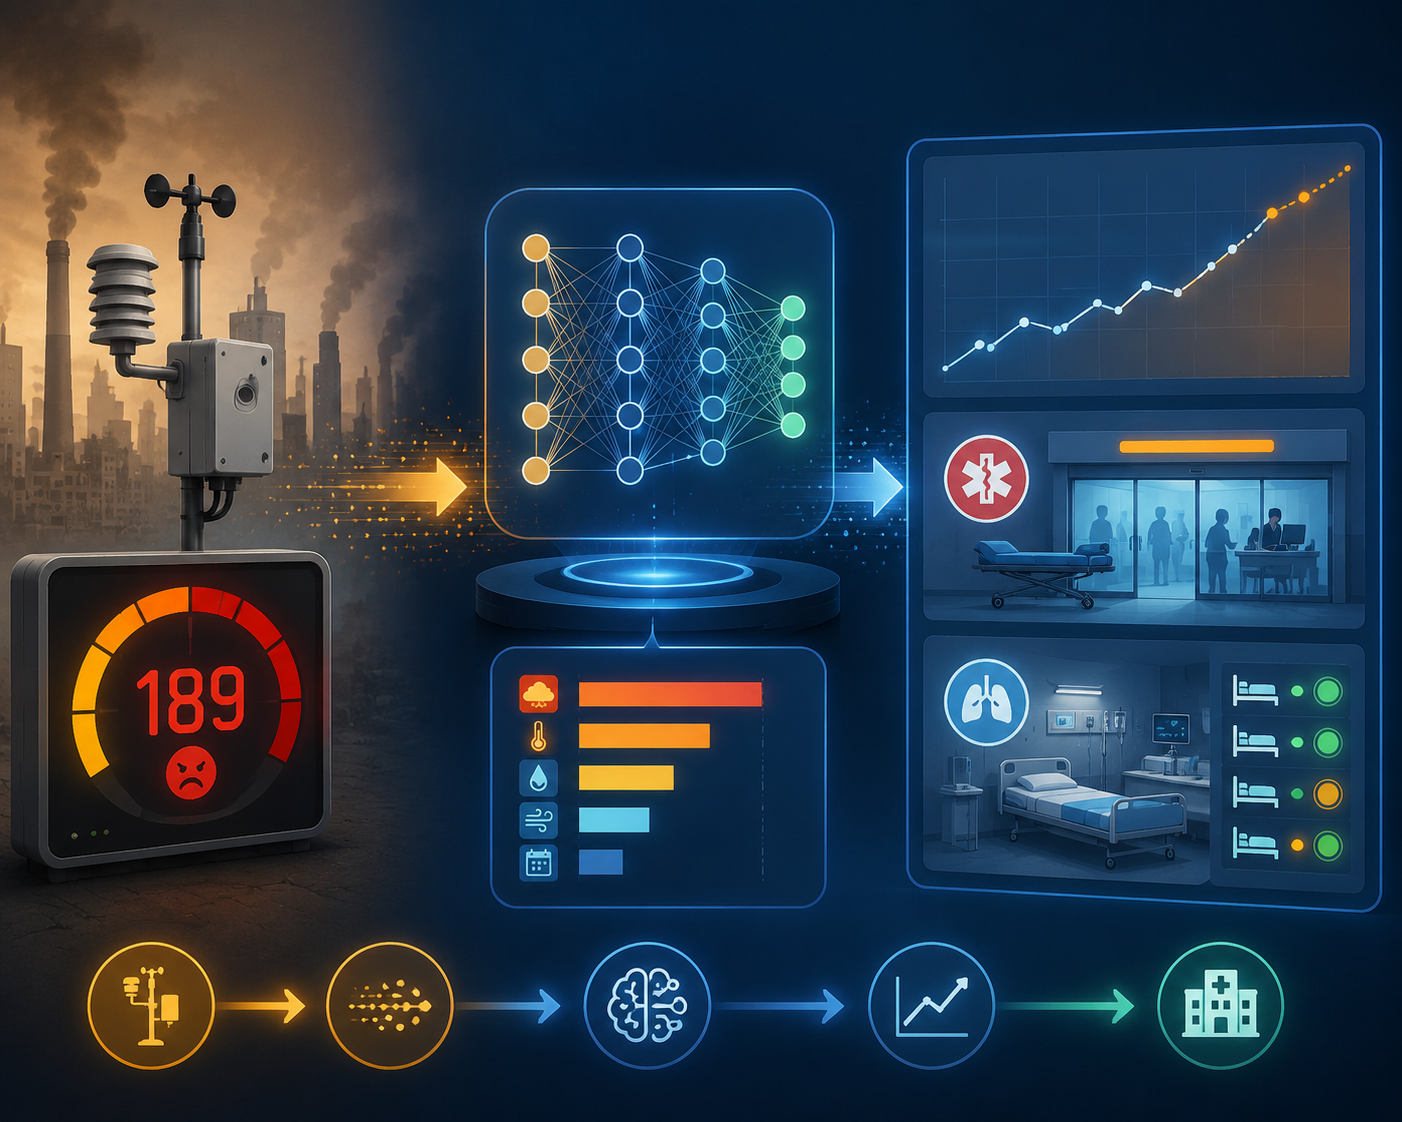
For an emergency department, that distinction changes the use case. A hazardous AQI classifier may justify public messaging or general awareness. A respiratory visit forecast can inform whether triage leaders should anticipate more wheezing children, more COPD exacerbations, more oxygen needs, or more outpatient calls from patients who are trying to decide whether symptoms can be managed at home. The model’s value depends on whether the forecast window matches the decision window. A prediction that arrives after staffing rosters are fixed is academically interesting but operationally weaker.
Peng et al. should not be stretched beyond what it shows. It is the only study in this evidence set that directly links AI AQI prediction to hospital or emergency department visit forecasting using clinical data.[4] That makes it the most clinically relevant source here, not proof that every AI AQI monitor can forecast admissions in every health system. Admission patterns depend on local baseline disease burden, access to outpatient care, medication availability, patient behavior, competing respiratory infections, and the thresholds clinicians and patients use for seeking care.
Still, the direction is important. Once AQI monitoring is linked to visit forecasting, the output can be reviewed by the people who carry consequences: ED charge nurses, respiratory therapy leaders, clinic schedulers, population health teams, and administrators responsible for surge plans. They need different levels of detail. A public health analyst may need a map. A clinic manager may need a patient list filtered by geography and chronic disease status. An ED operations lead may need expected timing and magnitude of demand, with uncertainty clearly shown.
What has to be visible before a model is trusted
For local adoption, the model card matters as much as the headline accuracy. A health system needs to know which pollutants entered the model, which AQI scale defined the outcome, how missing sensor data were handled, how often predictions update, what population data were used, and whether validation occurred in a setting resembling its own. Without those details, an impressive classification result is hard to translate into a clinical protocol.
- Inputs: pollutant measures, meteorology if used, sensor type, data latency, and missing-data handling.
- Outputs: AQI category, risk score, admission forecast, uncertainty interval, or spatial risk map.
- Update frequency: whether the system refreshes quickly enough for outreach, staffing, triage, or only retrospective surveillance.
- Population assumptions: age, disease status, density, mobility, and whether underserved groups are represented.
- Validation setting: geography, AQI scale, clinical data source, and whether performance was tested outside the development environment.
Interpretability can help, but it should not be oversold. SHAP-based explanations can show which features contributed most to a prediction, giving clinicians and administrators a way to inspect whether the model is behaving plausibly. If a forecasted respiratory surge is driven by pollutant exceedance, high vulnerability, and dense exposure, the result is easier to discuss than a black-box score. But interpretability does not replace external validation, and a plausible explanation can still be attached to a poorly transported model.
The geographic concentration of the evidence base also limits confidence. Most AI air quality monitoring studies in this brief come from India, China, and Southeast Asia.[1][2] Those settings are highly relevant to pollution health research, but their sensor networks, pollutant mixtures, AQI systems, population density, health care access, and hospital utilization patterns may differ from US or European clinical environments. A model that performs well in one region should be treated as a candidate system elsewhere, not as a finished clinical decision tool.
Where AI monitoring can reasonably change decisions
The most defensible use is not autonomous triage. It is earlier, better-targeted preparedness. If an AI monitoring system classifies hazardous AQI, overlays vulnerability, and shows a high-risk area near clinics that care for many chronic respiratory patients, the health system can move from general alerting to specific work: send targeted messages, prepare same-day respiratory slots, review oxygen and nebulizer capacity where relevant, and warn ED triage teams that environmentally triggered exacerbations may rise.
For population health teams, the same pipeline can support outreach prioritization. The important output is not a list of everyone exposed to poor air. It is a narrower group: patients who are exposed, vulnerable, reachable, and likely to benefit from timely advice or medication review. The system should make clear when it is identifying environmental exposure versus forecasting clinical utilization, because those are related but not interchangeable tasks.
For administrators, the strongest case is capacity planning during foreseeable pollution episodes. Peng et al.’s admission forecasting result suggests that AQI-related AI can move closer to predicting respiratory care demand, but the evidence is still thin because direct clinical linkage appears in only one study in this set.[4] Before broad reliance, a local health system would need to compare model forecasts against its own ED arrivals, clinic calls, admissions, and acuity patterns across multiple events.
A practical deployment threshold would therefore be conservative: use AI-based hazardous AQI monitoring as a decision-support layer while local validation accumulates. Let it trigger review, preparedness, and targeted outreach; do not let it silently determine care access or resource allocation without audit. The harm of a missed signal is obvious, but false confidence has its own cost. Staff can be pulled toward the wrong site, vulnerable patients can be overlooked, and communities with sparse data can remain invisible inside a polished dashboard.
A calibrated reading of the evidence
AI monitoring has moved hazardous AQI assessment beyond static environmental dashboards. The classification evidence is strong enough to take seriously, with reported 91–98% accuracy in studied settings.[1][2] The HRI framework shows how pollutant exceedance can be combined with population density and vulnerability into spatial risk maps that update every 5 minutes.[3] Peng et al. provides the key clinical signal: a machine learning model can forecast respiratory outpatient and emergency department demand during hazardous AQI events with very high reported fit in its setting.[4]
That makes AI-based AQI monitoring promising for health risk assessment when it is integrated with vulnerability data and admissions forecasting. It does not yet make it broadly generalizable clinical infrastructure. The evidence still needs external validation, jurisdiction-specific AQI translation, realistic testing under sensor noise and missing data, and better coverage of rural and underserved populations before health systems can rely on it widely for clinical operations.
References
- AI Assessment of Health Risk Based on Air Pollution: An Epidemiological Review. Springer. 2026.
- Application of artificial intelligence in air pollution monitoring and forecasting. ScienceDirect. 2025.
- Machine learning-driven framework for realtime air quality assessment and predictive environmental health risk mapping. Nature Scientific Reports. 2025.
- Peak Outpatient and Emergency Department Visit Forecasting for Patients With Chronic Respiratory Diseases Using Machine Learning Methods. JMIR. 2020.
Comments
Join the discussion with an anonymous comment.