
The first thing a polluted-city map does is pull the eye toward color: red corridors, purple basins, orange rings around highways. The second thing it should do is make the viewer suspicious. A city marked as having the “worst air quality” may be drawing from a dense monitor network, a satellite-derived estimate, a temporary sensor campaign, or a thin dataset stretched across a large population. For clinicians and public health teams, the useful question is not which city wins a grim leaderboard. It is whether the signal can help anticipate asthma admissions, cardiovascular events, COPD exacerbations, or neighborhood-level vulnerability before the clinic waiting room fills.
That is why AI tools for tracking worst air quality cities and health risks deserve attention, but not breathless acceptance. The exposure problem is large enough to justify better surveillance: IQAir’s 2025 World Air Quality Report, as summarized in its March 2026 press release, reported that only 14% of global cities met the WHO annual PM2.5 guideline of 5 µg/m³, down from 17% the prior year. The same release listed Pakistan at 67.3 µg/m³, Bangladesh at 66.1 µg/m³, Tajikistan at 57.3 µg/m³, Chad at 53.6 µg/m³, and the Democratic Republic of the Congo at 50.2 µg/m³ as the five most polluted countries by annual average PM2.5. Loni, India was reported at 112.5 µg/m³, or 22 times the WHO guideline.[1]
Those figures are useful for orientation, not sufficient for health-risk intelligence. They come here through a press release attributed to the report rather than a directly reviewed full PDF, and even the best annual average cannot show who is breathing the peak exposures, which clinics serve them, or whether admissions rise after particular pollution episodes. The more clinically relevant work begins when air quality data are linked to time, place, population vulnerability, and measured health outcomes.
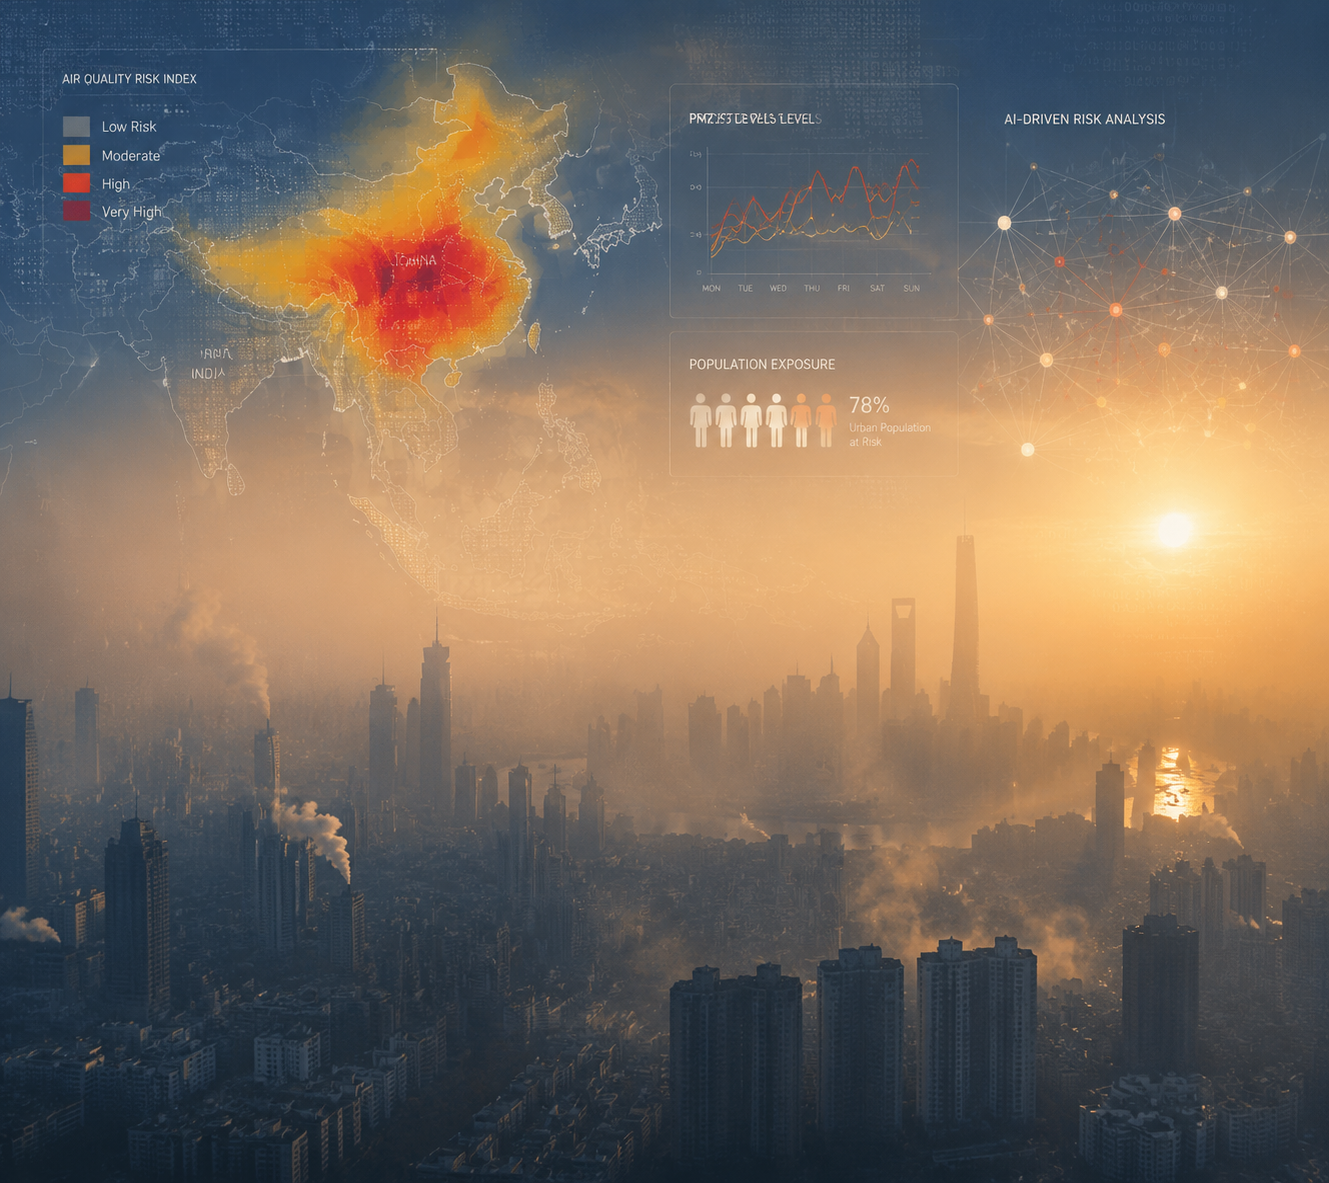
From polluted-city rankings to risk maps
A conventional city ranking compresses air pollution into a comparative score. A health-risk map has to do more. It has to estimate where exposure is rising, which populations are likely to be more susceptible, and what outcome is being predicted. Respiratory admissions are not the same endpoint as emergency inhaler use, upper respiratory tract disorders, lung cancer risk, or cardiovascular events. A model can perform well for one task and be clinically thin for another.
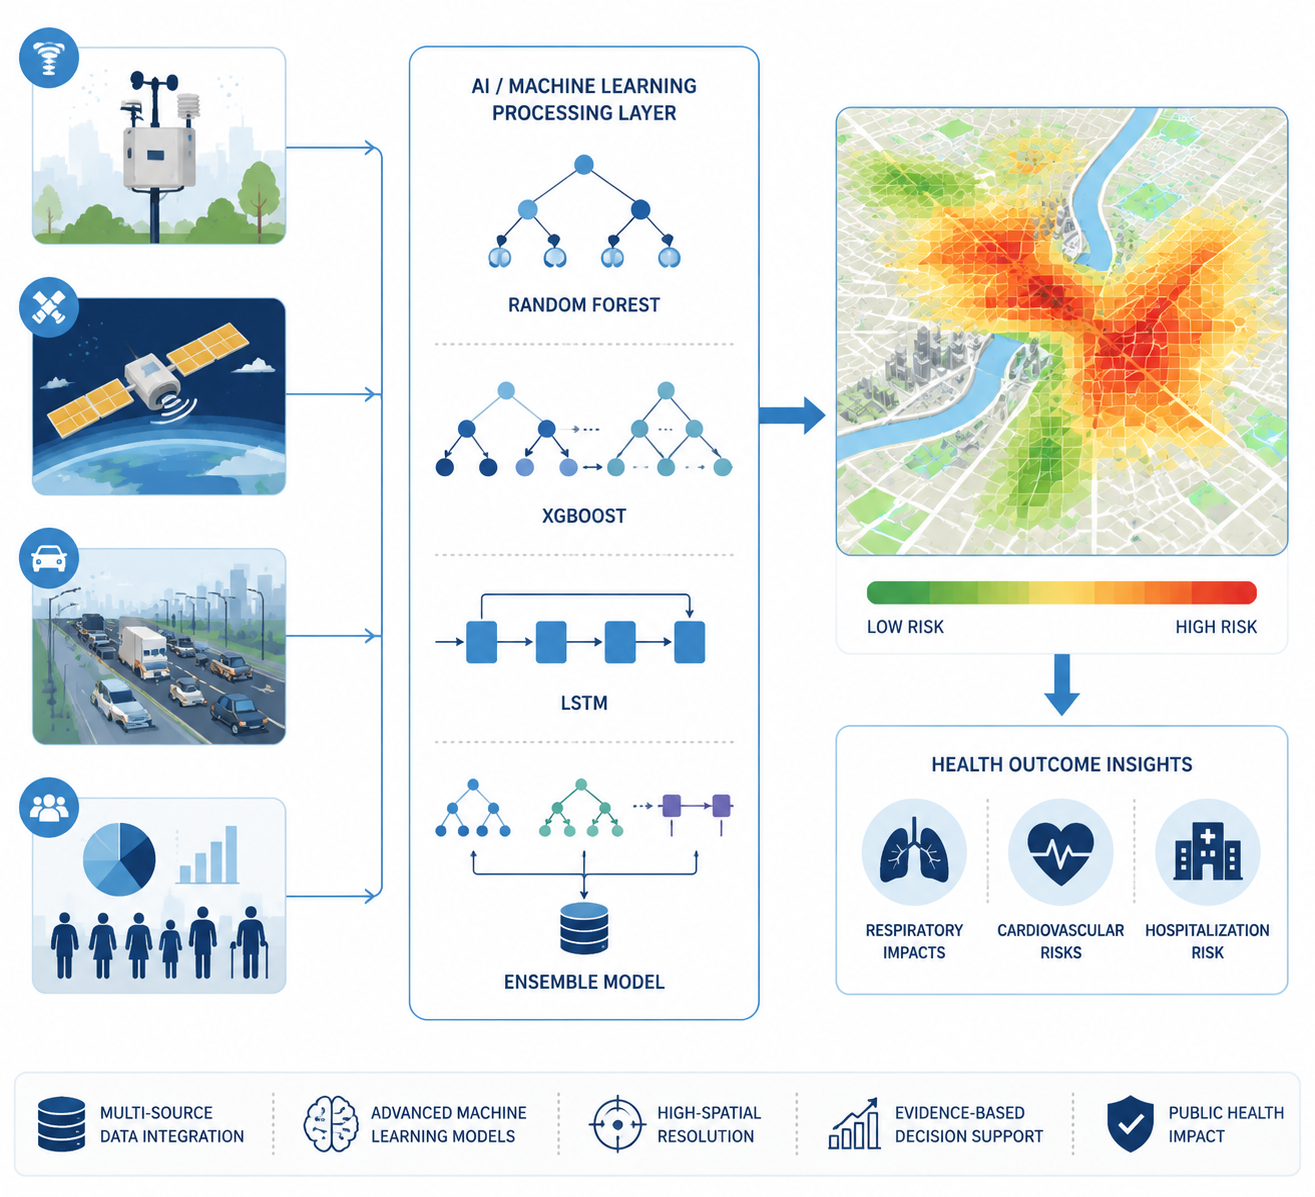
Modern AI workflows usually try to solve the missing-context problem by combining several streams: fixed regulatory monitors, lower-cost mobile or IoT sensors, satellite aerosol optical depth, meteorology, traffic intensity, land-use features, and demographic or clinical vulnerability overlays. The attraction is obvious. Fixed monitors are trusted but sparse. Satellites widen coverage but do not directly measure what a child breathes beside a road. Traffic and weather help explain short-term variation. Health and demographic layers move the map from ambient concentration toward population risk.
The weakness is just as obvious. Each new layer adds a chance for error, bias, latency, or overinterpretation. A beautiful map can make a modeled estimate look like an observed fact. In public health use, that distinction matters because the consequences are operational: whether a city issues warnings, adjusts school activity guidance, deploys outreach teams, or prepares respiratory services.
What the model evidence actually shows
The strongest broad evidence in the current material is a 2026 Springer review of 83 AI studies in air pollution and health. It found that machine learning techniques dominate this research area, with Random Forest the most frequently used prediction method and LSTM models used for time-series applications. PM2.5 was the dominant pollutant focus, appearing in 53 of 83 studies, or 63.9%; the next most common pollutant targets were NO₂ at 30.1%, O₃ at 27.7%, CO at 21.7%, and SO₂ at 19.3%.[2]
That distribution is not an accident. PM2.5 is small enough to penetrate deeply into the respiratory tract and is routinely used in epidemiologic and policy discussions, so it becomes the natural target for both exposure modeling and health-risk prediction. But dominance in the literature is not the same as completeness. A city with high PM2.5 may also have meaningful ozone episodes, nitrogen dioxide near traffic corridors, or locally important mixtures that do not fit neatly into a single-pollutant model.
| Model class | Why it appears in air pollution health studies | Interpretive caution |
|---|---|---|
| Random Forest | Handles nonlinear relationships and mixed predictor sets; most frequently used prediction method in the 2026 review | Variable importance can be useful, but strong retrospective fit does not prove prospective clinical utility |
| XGBoost | Often used where tabular environmental, meteorological, and population data need high predictive performance | Performance can depend heavily on feature engineering, data leakage control, and validation design |
| LSTM | Fits time-series tasks where prior pollution, weather, or admission patterns help predict near-term outcomes | Temporal validation matters; random splits can overstate real forecasting performance |
| Hybrid or ensemble models | Voting and bagging ensembles increased R² by an average of 9.6% over standalone models in the review | Incremental accuracy gains may not translate into clearer public health decisions |
The appeal of Random Forest and XGBoost is practical rather than mystical. Air pollution health datasets are messy: pollutant concentrations, humidity, temperature, holidays, day of week, traffic, population density, and lagged health outcomes may interact in ways that do not fit a simple linear form. Tree-based models tolerate many of those interactions and can perform well with mixed structured inputs. LSTM models enter when the timing itself is central, such as predicting admissions after recent exposure patterns rather than estimating risk from a single daily average.
The review’s ensemble finding is important because it reflects a common result in applied prediction: combining models can reduce the brittleness of any one method. Voting and bagging ensembles increased R² by an average of 9.6% over standalone models in the reviewed studies.[2] That is a meaningful statistical signal, but it still has to be judged against the task. A public health team may not need the highest possible R² if the model cannot explain which neighborhoods are driving the alert, cannot update on time, or has never been tested outside the city that generated the training data.
One result from the same review is almost too eye-catching: an ANN-MLP model predicted asthma admissions with a testing R² of 0.99.[2] That deserves interest, not awe. For a high-stakes health prediction problem, a near-perfect testing statistic immediately raises questions about sample structure, train-test separation, temporal leakage, endpoint definition, and whether the model was validated externally. The number may be true within the reported experiment and still not be enough to support deployment in another hospital catchment area.
Health outcomes are not interchangeable
The phrase “health risks” can hide too much. In this literature, AI models are being used across several outcome types: respiratory hospital admissions, asthma exacerbations, upper respiratory tract disorders, cardiovascular events, and longer-horizon cancer risk modeling. Each endpoint imposes a different evidentiary burden. A next-day admissions model can be evaluated as a forecasting tool. A lung cancer risk model tied to pollutant sources has to contend with longer latency, confounding, and exposure reconstruction.
Brief case studies show the breadth without proving universal readiness. Published work from Costa Rica examined prediction of respiratory admissions. A Turkey study analyzed upper respiratory tract disorders in a sample of 11,746. A China study modeled lung cancer risk from polycyclic aromatic hydrocarbons and reported that an Extremely Randomized Trees model outperformed Random Forest and XGBoost for source-specific risk.[2] The point is not that one algorithm is now the winner. It is that model choice depends on the pollutant, exposure window, endpoint, and data structure.
This is also where health IT integration becomes less glamorous and more consequential. A model trained on environmental data alone may flag a high-exposure zone. A model connected to hospital admissions, primary care records, COPD prevalence, age distribution, or medication access can begin to estimate who is more likely to need care. That does not make it a clinical decision-support tool by default. It makes it a candidate public health surveillance tool that still needs governance, validation, and a clear threshold for action. The same caution applies to broader AI clinical decision support: prediction becomes useful only when the workflow can absorb it responsibly.
The real-time mapping workflow is promising, with a thin validation layer
The most vivid example of where this field is trying to go is a Nature Scientific Reports framework published in spring 2025. It describes a system that integrates fixed and mobile sensors, satellite data, and demographic overlays to produce risk maps updated every five minutes, with SHAP-based interpretability to identify vulnerable populations by age, COPD prevalence, and proximity to traffic corridors. The architecture used Apache Kafka and a Google Cloud pipeline.[3]
As a design pattern, that is exactly the direction environmental health surveillance needs: multi-source ingestion, near-real-time processing, spatially resolved risk, and some ability to explain which variables are pushing a neighborhood into a higher-risk band. SHAP does not make a model clinically valid, but it can help reviewers see whether a system is responding to plausible drivers rather than opaque noise.
The limitation is not a footnote. The framework was based on simulated and retrospective data with n=100, and real-world sensor deployment plus health-record validation had not yet been published in the reviewed material.[3] That means it should be read as a prototype workflow, not as evidence that five-minute city health-risk maps are ready to guide routine public health action across settings.
A related deployment idea appears in discussions of AI-driven sensor fusion and “Virtual Stations,” where satellite data, reference stations, IoT wearables, and meteorological inputs are used to estimate air quality at locations without physical monitors. The Clean Air Fund and AI Journal material cited estimates of more than 90% accuracy for such virtual stations and described street-level pollution prediction and legal-limit breach detection.[4] That is useful infrastructure context, especially for under-monitored places. It is still a different claim from validated prediction of hospital admissions or cardiovascular events.
Where the evidence is strongest, and where it thins out
The current evidence base is not evenly distributed. Many AI air pollution health studies concentrate on Asian urban settings, where severe pollution exposure, dense populations, and increasing sensor and health data availability make the research both urgent and feasible.[2] That concentration strengthens the relevance of the literature for polluted megacities, but it weakens any claim that the same models will generalize cleanly to Sub-Saharan Africa, Eastern Europe, rural regions, or low-resource municipalities with sparse monitors and fragmented health records.
This matters because the places most in need of better exposure intelligence may be the least able to supply the data a high-performing model expects. A model can be technically elegant and still fail a practical equity test if it works best where monitoring is already dense. Virtual stations, satellite augmentation, and transfer learning may help, but the material reviewed here does not establish that they solve generalizability for low-resource settings.
It is also worth separating retrospective benchmark performance from deployable population health intelligence. Retrospective studies can show that pollutant, weather, and demographic signals are predictive of health outcomes. Prospective validation has to show that the model works on new data, in time to act, with acceptable false alarms and missed events, under local monitoring constraints. External validation has to show that the model has not merely learned one city’s hospital coding, traffic pattern, or seasonal artifact.
What a credible AI air-risk system should make visible
The best systems in this area will not simply produce more vivid pollution maps. They will make the chain from exposure to predicted burden inspectable. A public health analyst should be able to tell whether a high-risk alert is being driven by PM2.5, NO₂, traffic proximity, weather inversion, age distribution, COPD prevalence, or recent admissions. A clinician should not have to treat a citywide color gradient as if it were a patient-specific risk score.
- The pollutant target should be explicit, especially when PM2.5 is used as the main exposure proxy.
- The outcome should be clinically specific, such as asthma admissions, COPD exacerbations, cardiovascular events, or upper respiratory tract disorders.
- The validation design should match the intended use, with temporal and external validation favored over random retrospective splits.
- The data sources should be visible, including whether estimates come from fixed monitors, satellite inputs, mobile sensors, traffic data, or demographic overlays.
- The model output should be tied to an action threshold, not just a heat color or risk percentile.
These requirements are not anti-AI. They are what make AI useful beyond demonstration. Random Forest, XGBoost, LSTM, and ensembles are credible tools for finding nonlinear and time-dependent relationships in environmental health data. The evidence supports their value in retrospective city-level risk modeling, especially for PM2.5-linked respiratory outcomes. It does not yet support a broad claim that global deployment is validated for under-monitored or low-resource regions.
The right conclusion is therefore narrower and stronger: AI-driven air quality health-risk mapping is becoming a serious public health method, not just a dashboard aesthetic. Its strongest support comes from peer-reviewed retrospective studies and urban evidence bases where pollutant, meteorological, and health data can be connected. Its weakest point remains the one that matters most for global use: whether models trained in data-rich cities can produce reliable, actionable risk estimates for the populations breathing polluted air with the least monitoring around them.
References
- IQAir 2025 World Air Quality Report, PRNewswire / IQAir, March 2026
- 2026 Springer Review of 83 AI studies, Springer, 2026
- Nature Scientific Reports ML Framework, Scientific Reports, Spring 2025
- AI-driven sensor fusion and Virtual Stations, The AI Journal / Clean Air Fund
Comments
Join the discussion with an anonymous comment.