
Air quality index safety guidelines for wildfire smoke usually arrive as a public-facing instruction set: reduce outdoor activity, watch symptoms, protect sensitive groups. That is useful at the household level, but it is a thin operating tool for a health system. A hospital cannot create staffed respiratory capacity, review high-risk registries, or prepare care managers for outreach when the signal arrives at the same time as the smoke. The gap is not only informational. It is temporal.
That limitation matters because conventional AQI guidance does not automatically translate into measurable protection at population scale. In one JAMA Network Open analysis, following AQI activity guidelines on “Unhealthy for Sensitive Groups” days, defined as AQI 101–150, would require more than 5 million adults with atherosclerotic cardiovascular disease to adhere to activity restrictions to prevent one ASCVD event.[1] The finding does not mean AQI warnings are worthless. It means that publishing advice is not the same thing as changing risk for the people who are least able to avoid exposure.
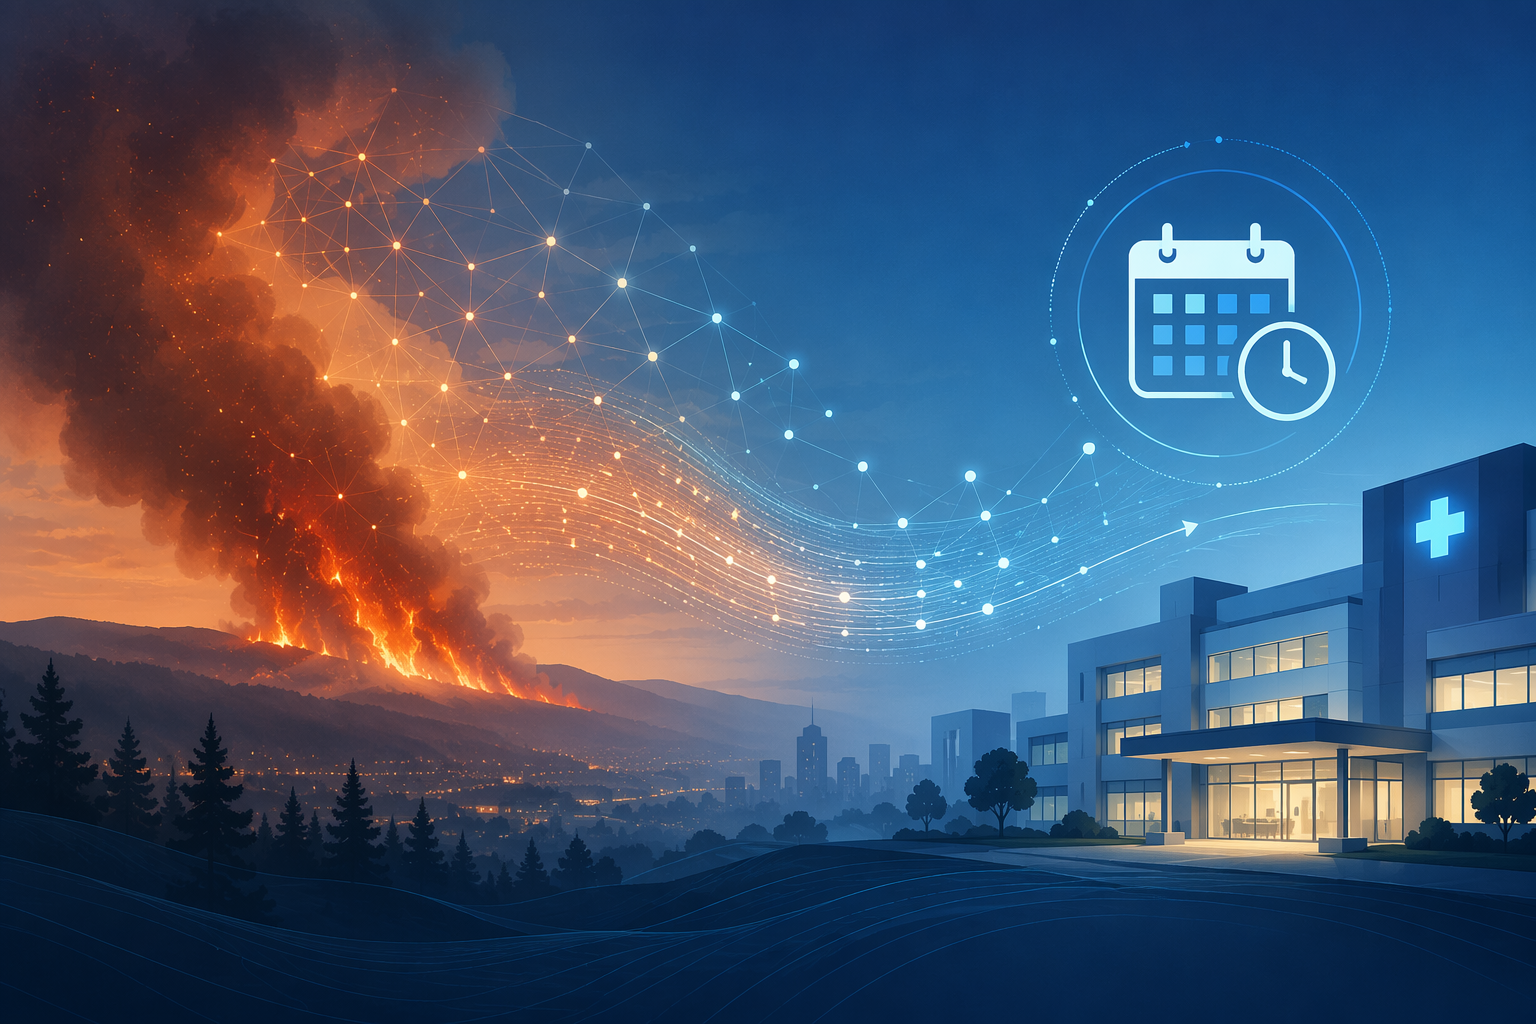
For clinicians and health IT leaders, the more important question is whether wildfire smoke PM2.5 risk can be forecast early enough to alter preparedness. Recent AI work is beginning to change that question from “What is the AQI now?” to “What operational window might we have before smoke-driven respiratory demand rises?”
The Clinical Value Is in Lead Time
The most consequential AI claims in wildfire smoke forecasting are not that a model is more sophisticated. They are that the model compresses time. Johns Hopkins Applied Physics Laboratory and NOAA described a deep-learning air quality emulator that can produce 10-day forecasts after taking in about 21 hours of input data.[2] For a hospital preparedness team, that difference is not abstract. Ten days is time to revisit staffing assumptions, identify clinics likely to see respiratory demand, and decide whether outreach to high-risk patients should happen before the air deteriorates.
The APL/NOAA system was trained on a single year of ensemble simulations and designed to mirror ground-truth air quality behavior while avoiding the full computational burden of traditional atmospheric chemistry models.[2] Those conventional models can involve months of data and more than 200 pollutants, making them expensive to run when decision-makers need repeated, practical forecasts.[2] The point is not that the emulator replaces physical modeling everywhere. It is that an emulator may make forecast production fast enough to fit the cadence of healthcare operations.
A second system, described by CIRES with NOAA and George Mason University collaborators, aims at a longer horizon: wildfire emissions prediction 35–45 days ahead.[3] The system combines seven global fire emission inventories and is described as being able to distinguish average from extreme fire seasons.[3] That is a different kind of lead time. A 10-day PM2.5 forecast can support near-term surge planning; a 35- to 45-day emissions outlook can inform seasonal readiness, staffing contingencies, and public health coordination before the calendar is already crowded by the event.
Both examples should be read carefully. The APL/NOAA and CIRES/NOAA findings come from institutional announcements, not from completed peer-reviewed validation papers in the materials available here. They are credible signals of where operational forecasting is moving, but they should not be treated as proof that every hospital can safely automate smoke-related clinical decisions today.
What AI Is Changing in the Forecasting Workflow
Traditional air quality forecasting has to represent physical and chemical processes across space and time. That is exactly why it is valuable, and exactly why it can be slow. Wildfire smoke adds more instability: the location, intensity, fuel conditions, plume behavior, and meteorology can change quickly. A model that is scientifically detailed but too slow to refresh for operational use leaves health systems in the familiar position of reacting after exposure has begun.
Deep-learning emulators approach the problem differently. Instead of running the full atmospheric model each time at full computational cost, the emulator learns from prior ensemble simulations and approximates the forecast behavior quickly enough to produce usable output on a shorter clock. In the APL/NOAA example, the practical claim is that roughly 21 hours of input data can support 10-day air quality forecasts.[2]
The CIRES/NOAA/George Mason approach addresses another part of the chain: fire emissions before they become local smoke exposure. By combining seven global fire emission inventories, the system tries to reduce dependence on any single inventory’s blind spots and provide a sub-seasonal view of whether emissions are likely to behave like an average or extreme fire season.[3] That does not tell an emergency department exactly how many patients will arrive on a given night. It can, however, change when health systems begin asking the capacity question.
| Forecasting advance | Reported lead time or input change | Operational meaning for healthcare |
|---|---|---|
| APL/NOAA deep-learning air quality emulator | 10-day air quality forecasts from about 21 hours of input data | Near-term planning for staffing, respiratory clinic readiness, patient outreach, and ED awareness |
| CIRES/NOAA/George Mason AI emissions system | Wildfire emissions prediction 35–45 days ahead using seven global fire emission inventories | Sub-seasonal planning for smoke-heavy periods, public health coordination, and seasonal capacity assumptions |
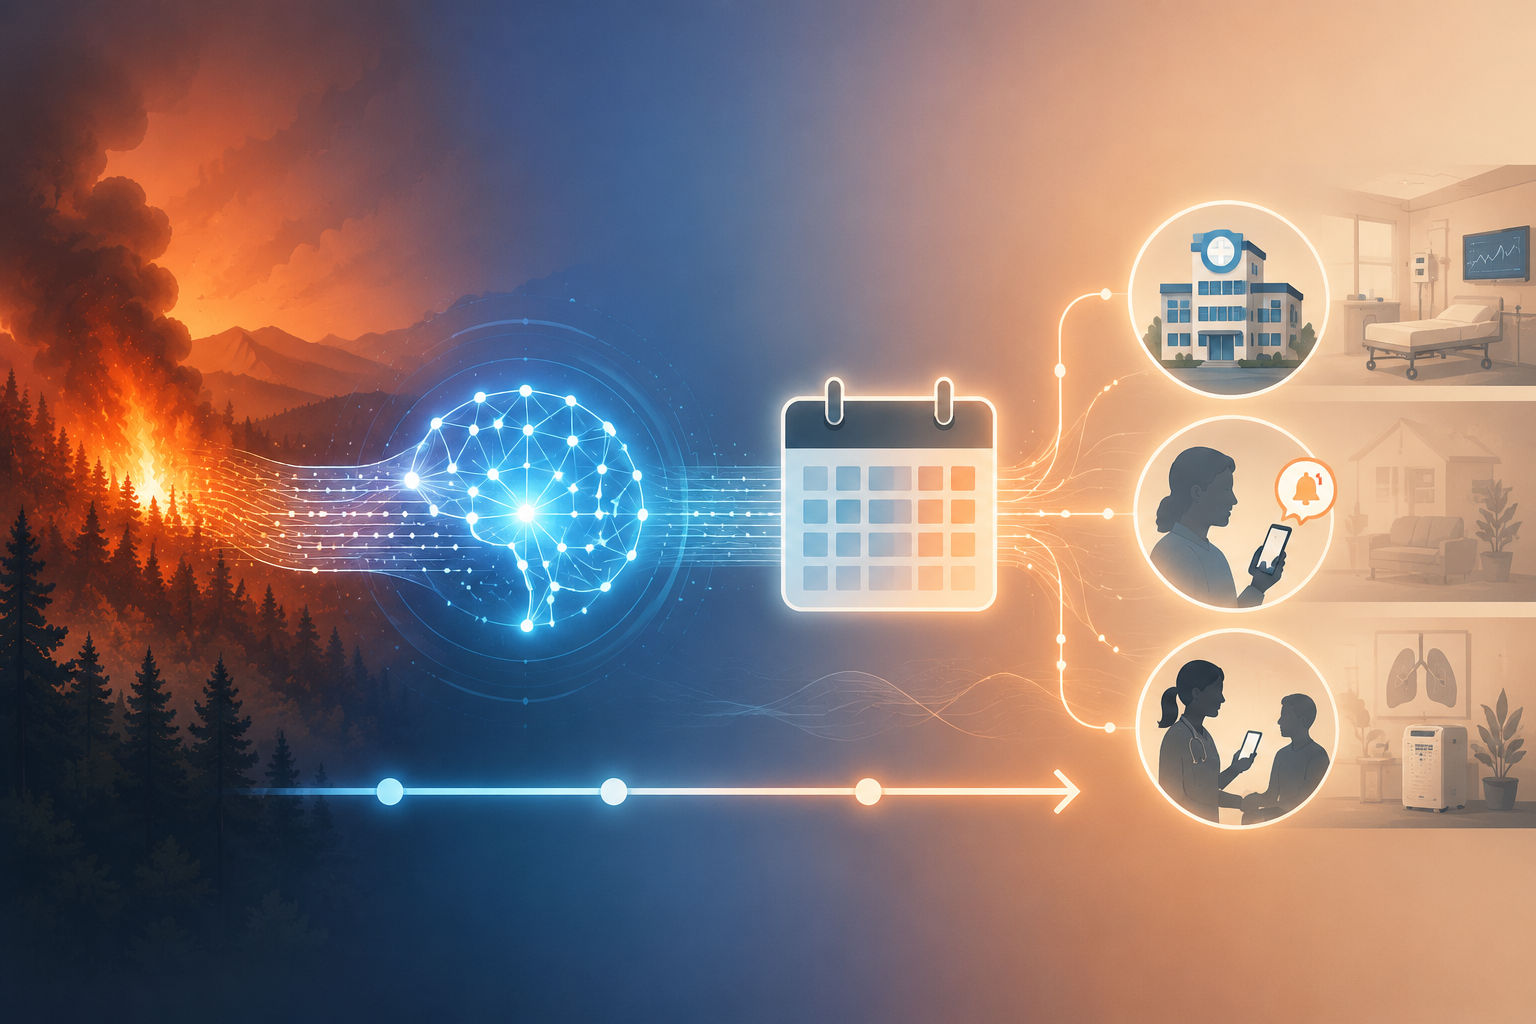
Those are not interchangeable tools. A PM2.5 forecast closer to the event can support tactical decisions. An emissions forecast weeks ahead can support preparedness posture. Conflating the two would overstate what either system does. Used together, they sketch a more useful timeline: first, a seasonal warning that smoke risk may be unusually high; then, a shorter-range estimate of when and where PM2.5 may become clinically relevant.
Why Wildfire PM2.5 Deserves More Than a Generic Pollution Alert
The case for better smoke forecasting depends on the health signal, not on the novelty of the modeling. Wildfire PM2.5 is not just another line item in an environmental dashboard. In a Nature Communications study, Aguilera and colleagues found that wildfire-specific PM2.5 was associated with up to a 10% increase in respiratory hospital admissions per 10 µg/m³ increase, roughly 10 times the estimated effect of non-wildfire PM2.5.[4]
That distinction changes how a health system should interpret a forecast. If a predicted PM2.5 rise is mostly wildfire smoke, the expected clinical burden may not be well represented by experience with ordinary urban particulate pollution. Respiratory clinics may see more exacerbations. Emergency departments may face a sharper concentration of visits among patients with asthma, COPD, cardiovascular disease, or limited ability to reduce exposure.
The health evidence does not prove that AI forecasts will reduce admissions. It explains why earlier and more specific smoke forecasts are worth testing in clinical workflows. A forecast only becomes clinically useful when someone knows what kind of exposure it represents, how far ahead the signal appears, and which operational owner is expected to act on it.
Where the Forecast Enters the Health System
A credible smoke forecast has several possible users inside a health system, and they do not all need the same output. ED leaders need timing, expected severity, and local confidence. Pulmonology and primary care teams need enough notice to message or schedule high-risk patients without flooding staff with low-value alerts. Population health teams need registries, language access, and outreach workflows ready before the event. Public health partners need a shared view of whether the forecast looks like a nuisance episode or a capacity-relevant exposure.
The simplest operational pathway is not a fully automated clinical directive. It is a forecast-triggered preparedness review. A 10-day signal may prompt teams to check respiratory staffing, inhaler refill outreach capacity, telehealth availability, and ED triage messaging. A 35- to 45-day emissions outlook may prompt a different conversation: whether the upcoming period deserves seasonal smoke planning, additional coordination with local public health, or scenario planning for vulnerable populations.
- Emergency departments can use lead time to anticipate respiratory presentations and review surge protocols without waiting for same-day AQI deterioration.
- Pulmonology and primary care practices can identify high-risk patients who may need pre-event communication, while avoiding claims that a forecast alone determines individual care.
- Population health teams can prepare outreach lists, staffing coverage, interpreter resources, and documentation pathways before smoke exposure peaks.
- Health IT teams can decide where forecast signals belong: dashboards, command-center views, care management queues, or public health reporting workflows.
The difference between those uses matters. A dashboard for command-center planning can tolerate more uncertainty than an automated patient message. A seasonal emissions outlook can support readiness discussions, but it should not be treated like a local clinical alert. The closer the forecast gets to a patient-facing action, the more the system needs transparent confidence, source attribution, and human review.
Accuracy Claims Need Operational Proof
Machine-learning studies have reported high PM2.5 prediction performance, including figures in the 92%–98% range in individual model settings. Those benchmarks are encouraging, but they do not settle the question healthcare teams care about most: whether the model performs reliably during the extreme smoke events that strain clinics and emergency departments.
Wildfire extremes create a distribution-shift problem. A model may perform well during common pollution patterns and still struggle when plume behavior, fire intensity, atmospheric conditions, or monitoring gaps produce an event outside its training experience. Health systems do not need perfection, but they do need to know when a forecast is being stretched beyond familiar conditions.
Prospective validation is therefore more important than retrospective accuracy alone. Useful evaluation would ask whether the forecast arrived early enough, whether local PM2.5 estimates were reliable enough for operational decisions, whether alerts were specific enough to avoid fatigue, and whether teams actually changed staffing, outreach, or triage behavior. Clinical utility starts after the atmospheric model produces a number.
What Health IT Leaders Should Require Before Trusting the Signal
The technical forecast is only one layer of the implementation problem. If smoke intelligence enters the electronic health record, command center, or care management platform without clear ownership, it becomes another environmental alert that everyone can see and no one is accountable to use.
The first requirement is source attribution. Teams need to know whether a forecast comes from an operational public agency product, a research emulator, a vendor model, or a local analytic layer built on public data. The second is lead-time labeling. A 45-day emissions outlook, a 10-day PM2.5 forecast, and a same-day AQI alert should not appear as equivalent signals. The third is workflow placement: the forecast should arrive where the responsible team already makes preparedness decisions.
- State what the model predicts: emissions, PM2.5 concentration, AQI category, or expected health-system demand.
- Show the forecast horizon clearly so teams distinguish seasonal readiness from near-term operational action.
- Expose confidence and known limitations, especially during extreme wildfire conditions.
- Assign an operational owner for review, escalation, and communication.
- Measure whether the alert changed preparedness behavior, not only whether the forecast was technically accurate.
That last measure is easy to overlook. A model can forecast wildfire smoke accurately and still fail clinically if no one has time, authority, or staffing flexibility to act. Conversely, a forecast with known uncertainty may still be useful if it triggers proportionate readiness steps rather than rigid patient-level instructions.
The Practical Boundary
AI-driven wildfire smoke AQI forecasting is promising because it can create what standard AQI safety guidance often lacks: actionable lead time. The APL/NOAA emulator points toward faster 10-day air quality forecasting from a compressed input window.[2] The CIRES/NOAA/George Mason system points toward sub-seasonal emissions intelligence 35–45 days ahead.[3] The health literature gives a clear reason to care about that timing, especially when wildfire PM2.5 carries a stronger respiratory admission signal than non-wildfire PM2.5.[4]
The boundary is equally clear. Forecasting skill is not the same as clinical effectiveness. The value of these systems depends on integration into real preparedness workflows, transparent source attribution, prospective validation, and performance under the extreme smoke episodes where hospitals most need advance warning. Better forecasts can open the window. Health systems still have to be able to use it.
References
- Estimated Cardiovascular Benefits of Air Quality Index Alerts Among Adults With Atherosclerotic Cardiovascular Disease — JAMA Network Open, 2024.
- Using Artificial Intelligence, Better Pollution Predictions Are in the Air — Johns Hopkins Applied Physics Laboratory, 2024.
- Artificial intelligence takes on wildfire emissions: A new frontier in forecasting — CIRES, 2026.
- Wildfire smoke impacts respiratory health more than fine particles from other sources: observational evidence from Southern California — Nature Communications, 2021.
Comments
Join the discussion with an anonymous comment.