
The hard part of wildfire smoke season is not noticing smoke once it has arrived. By then, school nurses are already keeping children indoors, respiratory therapists are already seeing symptoms, and emergency departments are already deciding whether the day’s volume is weather, virus, smoke, or all three. The useful question for health systems in 2026 is narrower: can AI-enhanced smoke forecasts give clinicians and operations teams enough lead time to change what they do before the plume reaches patients?
Increasingly, the answer is yes in an operational sense. Some models now produce forecasts that are specific enough to support patient outreach lists, asthma action plan triggers, clinic protocol changes, school activity decisions, and staffing discussions. But that is not the same as saying the tools are clinically proven. No study identified in the current evidence base has shown that deploying AI wildfire smoke forecasts reduces hospital admissions, emergency visits, or mortality. That distinction matters because wildfire smoke season health risks are real, while AI prevention claims can easily imply more certainty than the literature currently provides.

The forecast improvement that changes the conversation
The strongest current example is the Penn State deep-learning-refined WRF-Chem work on the June 2023 Canadian wildfire smoke event. In that case, researchers reported that adding a deep learning correction reduced PM2.5 forecast bias from −6.872 µg/m³ to 0.160 µg/m³, while also identifying environmental justice hotspots at the county level across the northeastern United States.[1]
That number is not a decorative accuracy claim. Bias is the kind of error that can quietly distort operations. If a model consistently underestimates smoke PM2.5, a hospital may wait too long to text high-risk patients, a pediatric clinic may leave routine outdoor guidance unchanged, and a school district may treat a bad exposure day as merely inconvenient. If a model overestimates exposure too often, the same system can burn staff attention, cancel outdoor activity unnecessarily, and make future alerts easier to ignore. A reduction of that size means the forecast is closer to the measurement a decision-maker would need, not just closer to a leaderboard score.
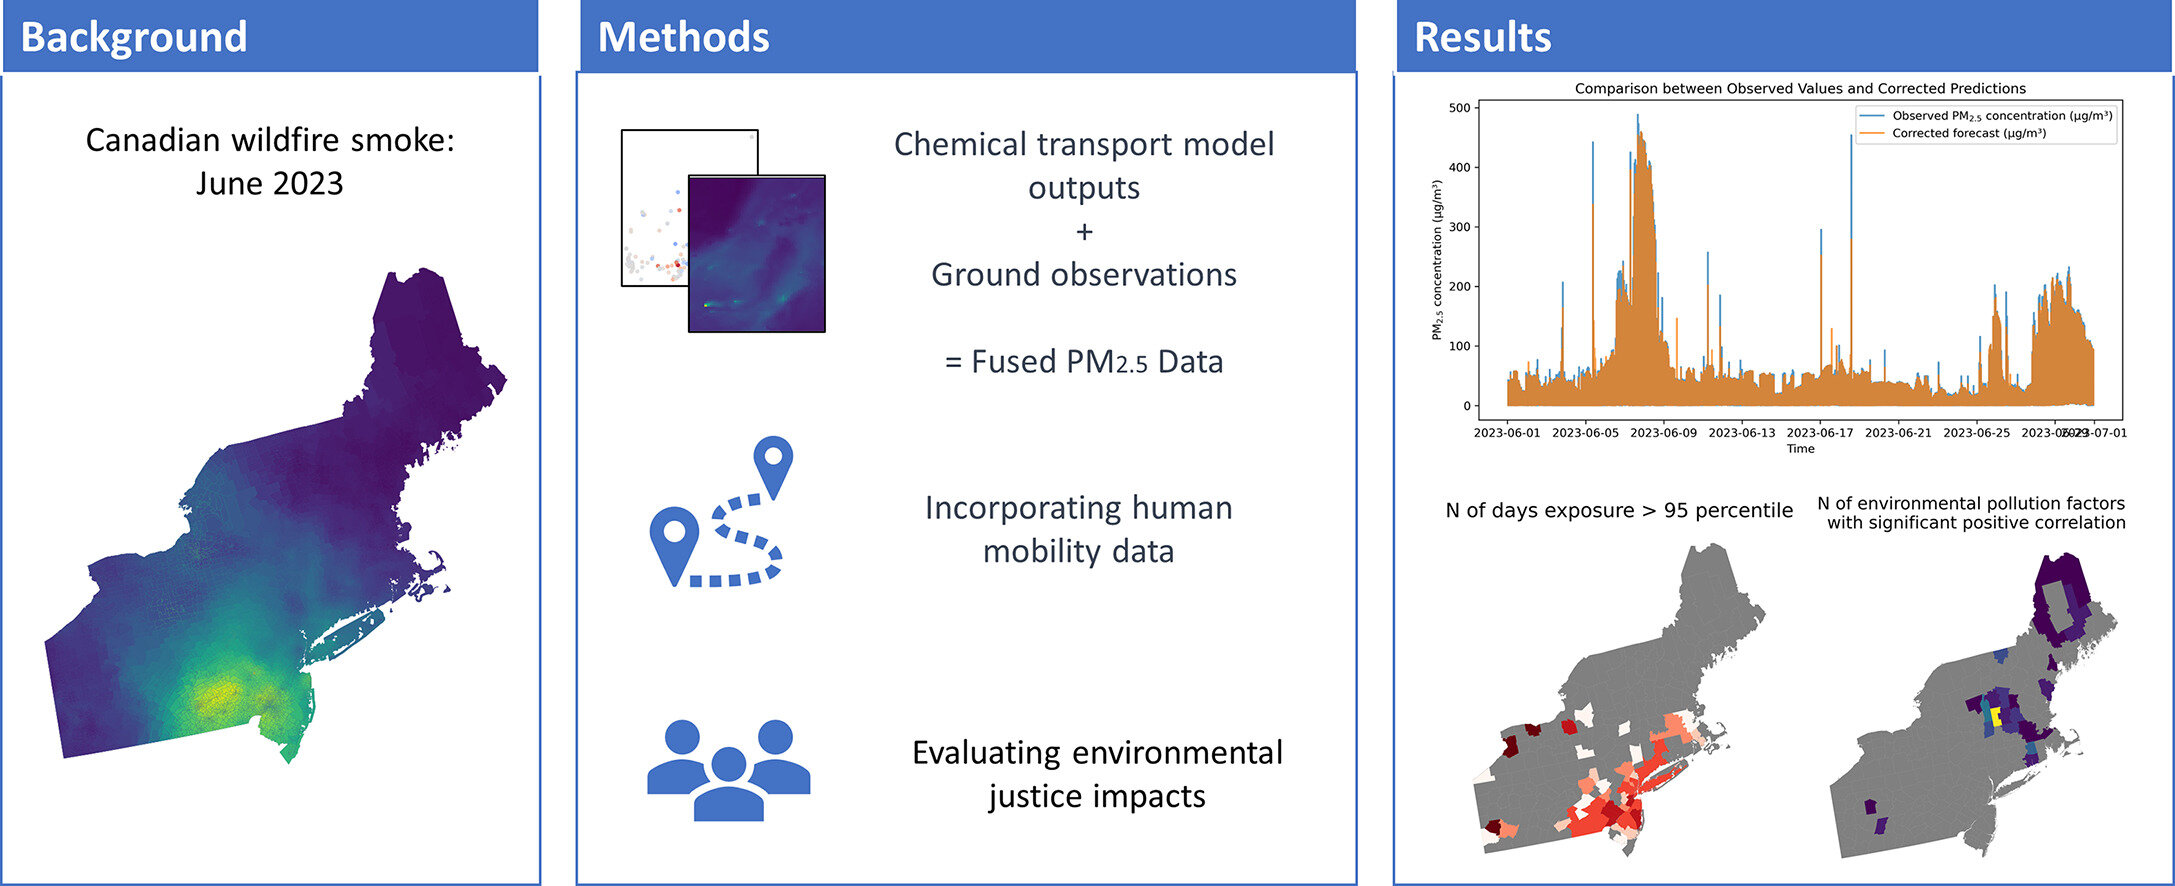
The county-level environmental justice signal is just as important as the aggregate improvement. Wildfire smoke does not become a health-system problem only when a regional map turns red. It becomes operational when the exposed area overlaps with older adults, patients with asthma or heart failure, Medicaid-covered populations, outdoor workers, children in schools without adequate filtration, and neighborhoods where patients have fewer ways to avoid exposure. County-level hotspot identification gives a health department or health system a plausible starting point for prioritization, even though it does not by itself prove that a specific intervention helped.
The correct clinical reading of the Penn State result is therefore disciplined but not timid. It supports the claim that smoke forecasting has matured enough to inform public health intervention planning. It does not support the stronger claim that a hospital using this forecast will reduce admissions. Forecast accuracy is one link in the chain. The remaining links are notification, interpretation, workflow, patient behavior, exposure reduction, and measurable clinical outcome.
Different forecast horizons answer different clinical questions
A single phrase like AI smoke forecasting hides a practical difference that matters in command rooms: some tools are useful for the next shift, some for the next few days, and some for planning several weeks ahead. Treating those horizons as interchangeable is how a promising forecast becomes a vague dashboard.
| Forecast or measurement layer | Operational horizon | What it can reasonably support | What it does not prove |
|---|---|---|---|
| Deep-learning-refined WRF-Chem smoke modeling | Event-scale forecasting and hotspot identification | Earlier targeting of counties, vulnerable populations, and public health intervention zones | Reduced admissions, ED visits, or deaths |
| Trace AQ Aero | Four-day smoke forecasting, with a free one-day public forecast tool | Staffing review, patient messaging, outdoor-space decisions, asthma action plan prompts | That a given health system’s response improved outcomes |
| CIRES/NOAA AI fire-emission estimates | Sub-seasonal 35–45 day smoke prediction | Preparedness planning, seasonal resource awareness, scenario planning | Reliable prediction during the most extreme events |
| EPA Fire & Smoke Map with local sensor networks | Real-time local verification | School, clinic, and community decisions when local exposure differs from regional expectation | Clinical benefit from sensor deployment alone |
Trace AQ’s Aero model sits in the most immediately usable band for health-system operations. The company describes a physics-based AI model that provides four-day advance smoke forecasts, along with a free one-day public forecast tool.[2] Four days is not enough time to remodel a ventilation system, but it is enough time to review weekend staffing, prepare respiratory therapy coverage, draft patient messages, flag high-risk registries, coordinate with schools or shelters, and decide whether outdoor clinics, camps, athletic events, or mobile services need alternate plans.
This is where prevention becomes concrete. A pediatric clinic does not need a perfect seasonal model to prepare a script for families of children with asthma. A population health team does not need certainty to pull a list of patients with chronic obstructive pulmonary disease, heart failure, recent respiratory admission, or home oxygen use. An emergency preparedness lead does not need proof of admission reduction before asking whether triage, call-center, and urgent-care capacity will be adequate if smoke arrives during a heat wave.
The longer-horizon work from a CIRES/NOAA multi-institutional team belongs in a different category. In January 2026, the team reported that machine learning and AI-based fire-emission estimates can extend smoke prediction to sub-seasonal scales of 35–45 days, while also noting that skill degrades on extreme wildfire events.[3] That is useful for preparedness planning, not for deciding which patient should receive a same-day warning. The caution is built into the finding: the events with the greatest potential clinical consequences are also the ones where forecast skill may be hardest to preserve.
Local measurement is the reality check
Forecasts create lead time. Sensors tell people whether the air outside a school, clinic, or neighborhood is behaving the way the forecast implied. That local verification layer is especially important during smoke events because exposure can vary sharply over short distances, and because the person making the decision often cannot wait for a perfect after-action analysis.
Clarity reports that EPA’s AirNow Fire & Smoke Map includes more than 550 Clarity Node-S sensors and is expected to reach about 1,050, with solar-powered and cellular-connected sensors described as resilient to power and communications infrastructure failures.[4] Because those counts come from a vendor blog post, they should be treated as vendor-source deployment claims rather than independent effectiveness evidence. Still, the deployment model is operationally relevant: health departments and school districts are exactly the institutions that need local, timely smoke information.
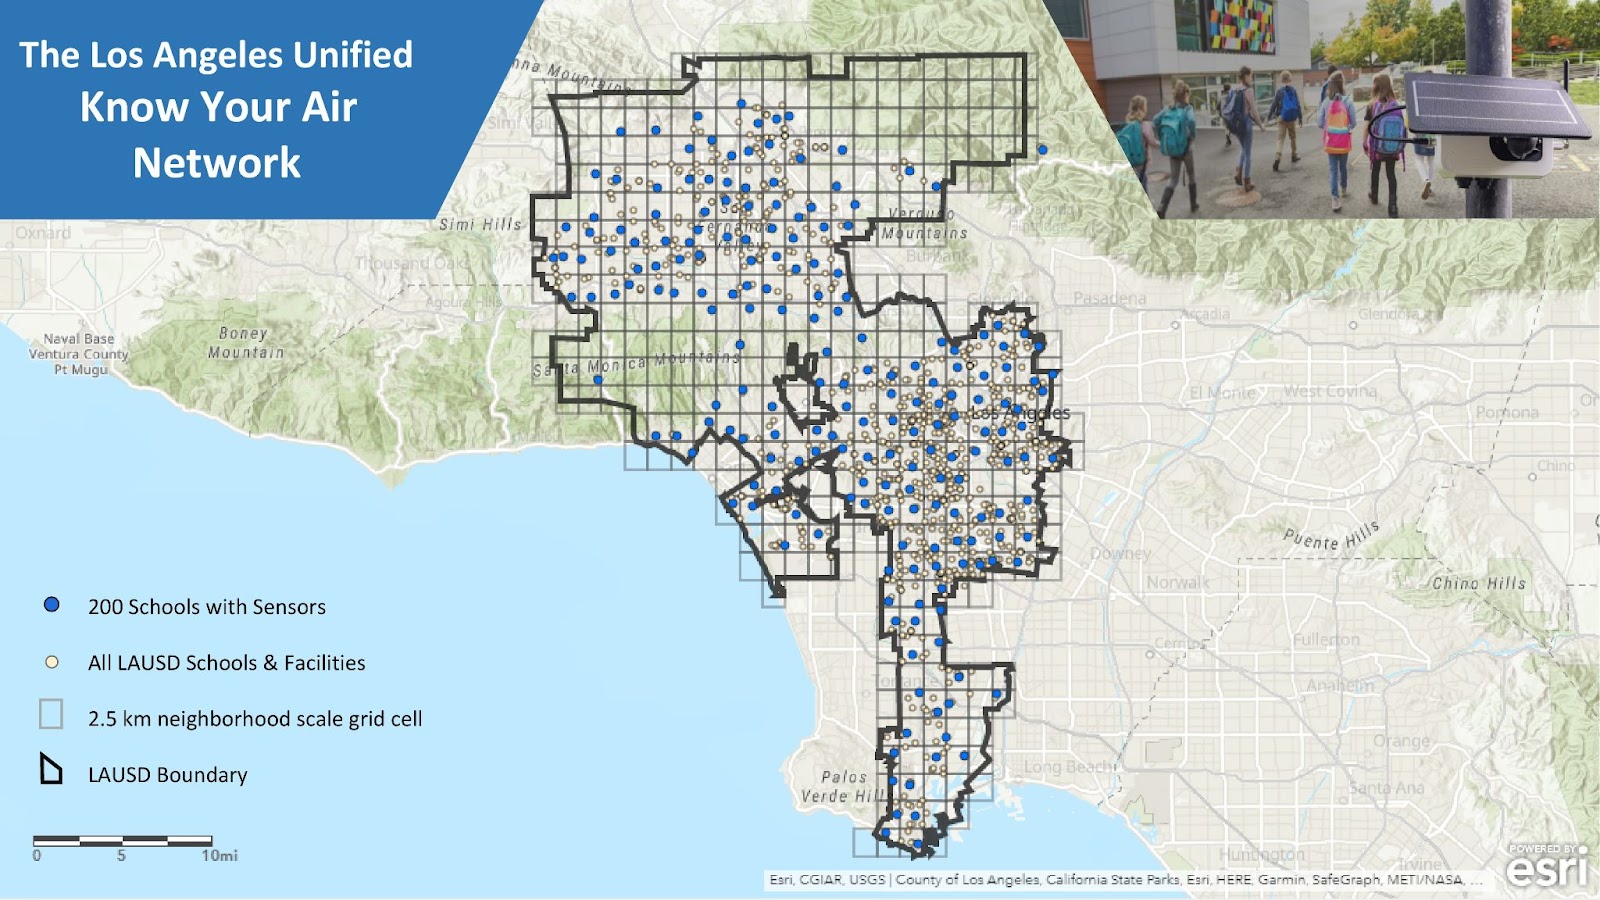
The Los Angeles Unified School District example is more persuasive than a generic smart-city pitch because it shows the operating environment. Clarity says more than 200 sensors across LAUSD provided real-time data during the January 2025 Los Angeles wildfires.[4] In that setting, the decision is not abstract. Children are outside or they are not. Recess continues or moves indoors. A school nurse reassures families or escalates concern. A district has to decide before every parent has the same view of the smoke.
For hospitals and clinics, the same logic applies at a different scale. A regional forecast might justify preparing outreach. Local sensor confirmation might determine whether outreach becomes urgent for one service area and merely advisory for another. Neither the forecast nor the sensor is the intervention. The intervention is the phone call, message, appointment change, inhaler plan, indoor-air guidance, filtration support, staffing adjustment, or school activity decision that follows.
Why acting before smoke arrives is clinically meaningful
The argument for earlier action does not rest on AI enthusiasm. It rests on the health risk profile of smoke exposure. A June 2025 JACC study described as the first national population-based analysis linking wildfire smoke to heart failure found that each 1 µg/m³ increase in two-year average smoke PM2.5 was associated with a 1.4% increase in heart failure risk, compared with 0.5% for non-smoke PM2.5. The researchers estimated that this equated to more than 20,000 additional heart failure cases annually among older adults in the United States, with stronger associations in women, Medicaid-eligible individuals, and lower-income groups.[5]
That finding does two jobs for a health system. First, it widens smoke response beyond asthma and acute respiratory symptoms. Heart failure clinics, cardiology practices, care management teams, and home health programs have a stake in smoke readiness. Second, it sharpens the equity question. If risk is stronger in Medicaid-eligible and lower-income patients, then a forecast tool that only informs well-resourced patients through a portal message may widen the gap between those who can act on warnings and those who cannot.
The toxicity signal adds more pressure. Stanford researchers reported that wildfire smoke is approximately 10 times more toxic than fossil-fuel PM2.5 and that no safe level of exposure has been identified.[6] That does not mean every forecast should trigger maximal response. It does mean that small exposure differences should not be dismissed as mere nuisance, especially when they affect patients with limited physiologic reserve.
Longer-term projections also make the operational problem harder to treat as exceptional. A Nature study by Qiu and colleagues projected 71,420 excess deaths per year from wildfire smoke PM2.5 by 2050 under SSP3-7.0, a 73% increase, and 1.9 million cumulative excess deaths from 2026 through 2055.[7] Projections are not local operating instructions, but they do argue against building smoke response as an improvised annual side project.
What a clinically actionable smoke forecast would change
A forecast becomes clinically actionable only when someone has already decided what happens at each threshold. In a disciplined pilot, the forecast does not land as a colorful map in an inbox. It lands inside a playbook that names the owner, the patient group, the message, the clinical escalation path, and the point at which the action stops.
The first workstream is pre-screening. Before smoke arrives, a health system can identify patients with asthma, COPD, heart failure, pregnancy, recent hospitalization, home oxygen use, frailty, or medication access problems. The forecast does not diagnose risk; it tells the system when that standing risk list becomes time-sensitive. A care manager can then prioritize the patients least likely to see or understand a general public alert.
The second is patient communication. A generic warning that “air quality may be poor” is weak clinical decision support. A more useful message tells a patient what to do differently: check rescue inhaler supply, follow the asthma action plan, keep windows closed when possible, use available filtration, avoid outdoor exertion, move an appointment to telehealth if appropriate, or call if symptoms cross a defined line. For some patients, the message should go to a caregiver rather than only to the portal account no one opens.
The third is clinic workflow. Pediatric clinics may need to prepare nurse triage scripts, adjust school and sports notes, review nebulizer and inhaler refill pathways, and decide whether routine outdoor counseling should become part of pre-visit planning during forecasted smoke days. Cardiology and primary care teams may need a different script for patients with heart failure: weight changes, dyspnea thresholds, medication adherence, cooling needs, and when to seek care.
The fourth is emergency and urgent-care readiness. A four-day forecast can justify reviewing respiratory therapy availability, triage staffing, oxygen and nebulizer capacity, discharge follow-up coverage, and call-center scripts. It may also help hospitals coordinate with skilled nursing facilities, shelters, schools, and public health agencies before everyone is competing for the same attention during the event.
The fifth is community decision support. Schools, athletic programs, outdoor workers, and mobile clinics often need binary choices on short timelines. Forecasts help them prepare; local sensors help them verify; clinical partners can help translate exposure information into protective action for children, older adults, and medically fragile groups. The LAUSD case shows why the sensor layer matters: a district-scale decision still has to be made campus by campus when smoke behaves unevenly.
The evidence gap should be built into the pilot, not hidden in the appendix
The temptation with better environmental AI is to call the forecast the intervention. That is too generous. A smoke forecast is closer to an early warning input for clinical decision support. It may be necessary for prevention, but it is not sufficient. The clinical test is whether the forecast-driven workflow changes exposure, symptom escalation, utilization, or equity in a measurable way.
A serious 2026 pilot should therefore measure more than model accuracy. At minimum, it should track whether alerts arrived early enough to act, which patient groups were flagged, who received outreach, which patients opened or answered messages, which clinics changed protocols, how often local sensor data confirmed or contradicted the forecast, and whether staff found the process usable during a real event.
- Downstream utilization: asthma visits, COPD exacerbations, heart failure contacts, ED visits, admissions, and avoidable return visits during and after smoke events.
- Missed alerts: smoke events that were clinically significant but not forecast or not escalated in time.
- False alarms: alerts that triggered operational work without meaningful local exposure, especially if they caused alert fatigue.
- Equity effects: whether Medicaid-eligible, lower-income, older, non-English-speaking, and medically fragile patients received useful warnings and had realistic ways to act.
- Workflow burden: staff time, after-hours escalation, duplicated messages, unclear ownership, and conflicts between forecast sources.
This measurement posture is not academic fussiness. It is how a health system avoids mistaking activity for benefit. A command center can send thousands of messages and still fail if the messages reach the wrong patients, arrive too late, are too vague to change behavior, or create extra demand without reducing exposure.
A practical posture for 2026
AI-enhanced wildfire smoke forecasts are clinically actionable in the limited but important sense that they can support earlier population health operations. The Penn State bias reduction shows that model refinement can materially improve exposure estimates during a real smoke event. Four-day tools such as Trace AQ’s Aero map onto the time window in which hospitals, clinics, schools, and public health agencies can actually change staffing, messages, and protocols. Sub-seasonal CIRES/NOAA work may help with preparedness planning, while local sensor networks can verify whether the air around a school or clinic matches the forecast.
They are not yet clinically proven in the stronger sense. The current evidence does not show that using these forecasts reduces admissions, ED visits, or mortality. Health systems should not buy or deploy them as if that outcome evidence already exists.
The defensible path is a structured pilot where smoke exposure, vulnerable populations, and operational readiness overlap. Use the forecast to act earlier, use local data to verify conditions, and measure what happens downstream. If the tool changes only situational awareness, it is a dashboard. If it changes the right patient list, the right phone call, the right clinic protocol, and the right school or staffing decision — and the system measures the consequences — it becomes a credible part of wildfire smoke season health risk management.
References
- Improved wildfire smoke model identifies areas for public health intervention, Penn State University, May 2024.
- Trace AQ, Trace AQ.
- Artificial intelligence takes wildfire emissions into a new frontier for forecasting, CIRES, January 2026.
- Clarity Approved for EPA’s Fire and Smoke Map: A Major Milestone for Indicative Air Quality Monitoring, Clarity.
- Repeated Exposure to Wildfires Can Incrementally Increase Heart Failure Risk, American College of Cardiology, June 2025.
- Assessing wildfire health risks, Stanford, January 2025.
- Wildfire smoke exposure and mortality burden in the USA under climate change, Nature, September 2025.
Comments
Join the discussion with an anonymous comment.