
The useful question is not whether AI can forecast wildfire smoke health impacts in the abstract. It is whether a public health official can look at a smoke forecast, an exposure surface, and a predicted count of respiratory or cardiovascular visits, then decide what to do without mistaking model smoothness for operational certainty.
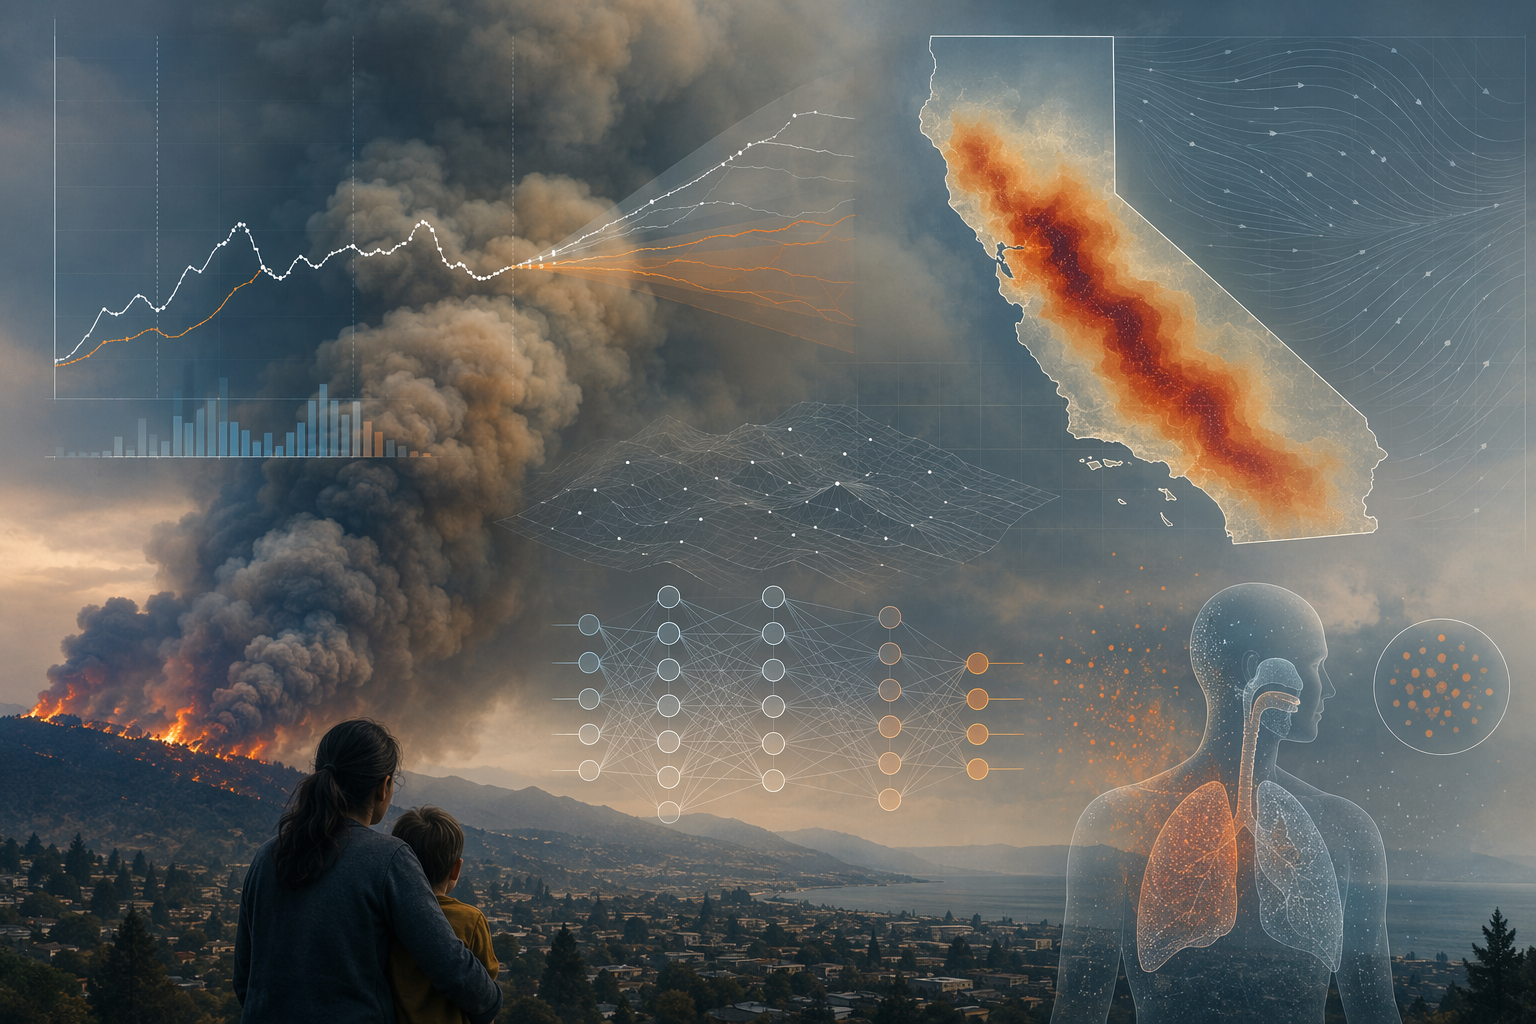
The current evidence says machine learning can help assemble that picture, especially when the goal is situational awareness. The strongest health-outcome example is a Prophet-XGBoost hybrid model applied to the 2018 Camp Fire, which estimated excess respiratory hospitalizations and outperformed conventional time-series baselines in a California test setting.[1] A separate California emergency department study complicates the interpretation of those outputs: at extreme smoke levels, total ED visits can fall while respiratory-specific visits rise sharply, meaning observed utilization is partly a behavioral signal, not just a disease-incidence signal.[2] Exposure modeling work provides the daily wildfire-specific PM2.5 surfaces these health models need.[3] National syndromic surveillance from the 2023 Canadian wildfire smoke episodes shows why the problem is no longer a California-only concern, even though that surveillance analysis was not itself a machine learning deployment study.[4]
The Forecasting Stack Starts With Modeled Exposure
A health forecast cannot be better grounded than the exposure estimate feeding it. In wildfire smoke work, that exposure is rarely a direct personal measurement. It is usually a modeled estimate of PM2.5 over space and time, with wildfire-specific attribution layered onto monitoring, satellite, meteorological, and related data streams.
Childs et al. built an ensemble-based machine learning approach to estimate daily wildfire-specific PM2.5 at 10 by 10 km resolution across the contiguous United States.[3] That kind of product matters because hospital admissions and ED visits are recorded at administrative and geographic units, while smoke moves as a plume with changing concentration, transport, and timing. A county-day health outcome model needs an exposure value for that county-day, even when no monitor sits in exactly the right place.
This is where the forecasting problem becomes more than a neural network label. The exposure model is doing one job: reconstructing a daily, spatially resolved smoke field. The health model is doing another: estimating how departures in that field relate to departures in hospitalizations or ED visits. A convincing analysis keeps those jobs separate enough that the reader can see where uncertainty enters.
The caveat is not a minor technical footnote. PM2.5 exposure estimates are modeled rather than individually measured, and the uncertainty in those estimates is not generally carried all the way through the downstream health-outcome forecasts. That can make intervals around predicted health burden look cleaner than the underlying chain of measurement justifies. For an analyst explaining a post-event forecast error, this distinction is not academic.
The Camp Fire Model Is the Most Direct Test
Dey et al. provide the clearest example of a machine learning model built to forecast wildfire-smoke-attributable respiratory hospitalizations. The study focused on California from 2009 through 2018 and used the 2018 Camp Fire as the central event for estimating excess respiratory hospitalizations.[1] It is valuable because it does not stop at mapping smoke or estimating a retrospective association. It asks what a forecasting architecture can add when the health endpoint is a count of hospitalizations.
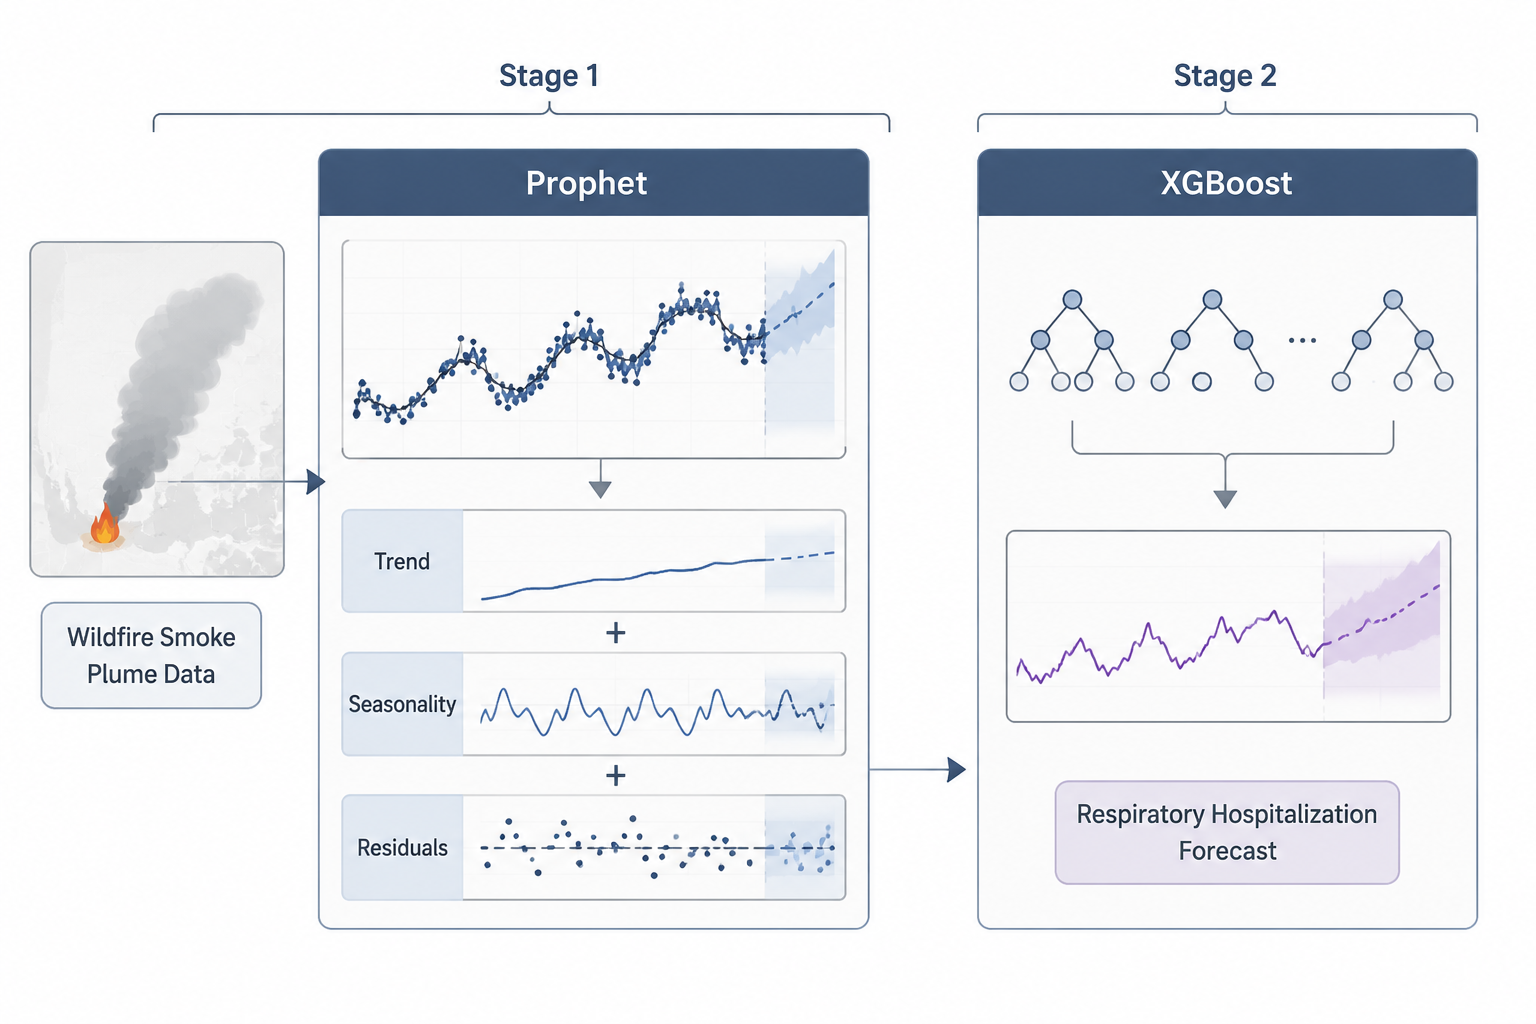
The design is a two-stage interrupted time-series setup. In plain terms, the first stage establishes what would have been expected without the wildfire smoke disruption, while the second stage uses a hybrid time-series and machine learning architecture to improve the forecast of respiratory hospitalizations during the event window. The interruption matters because the Camp Fire was not a small perturbation around ordinary air quality; it was a discrete smoke episode superimposed on seasonal, secular, and healthcare-use patterns.
Prophet and XGBoost are doing different work inside the hybrid. Prophet is suited to decomposing time-series structure such as trend and seasonality. XGBoost can then model nonlinear residual patterns and interactions that a more rigid time-series model may miss. For wildfire smoke, that combination is plausible: the baseline hospital series has calendar structure, while the smoke-health relationship may be irregular, delayed, and nonlinear.
In testing for San Francisco County, the Prophet-XGBoost hybrid achieved an R² of 0.69 and outperformed ARIMA and NNETAR baselines.[1] The reported estimate for the Camp Fire period was 92 excess respiratory hospitalizations, corresponding to a 12.5% attributable fraction.[1] Those are the numbers that make the study operationally interesting: a respiratory service or health department can understand an excess count more readily than an abstract model score.
| Evidence Component | Role in Forecasting Smoke Health Impacts | What It Does Not Prove |
|---|---|---|
| Childs et al. ensemble PM2.5 model | Creates daily wildfire-specific PM2.5 exposure surfaces across the contiguous United States | Does not itself forecast hospitalizations or ED visits |
| Dey et al. Prophet-XGBoost model | Forecasts respiratory hospitalizations and estimates excess burden during the Camp Fire | Does not establish prospective performance outside California or outside a similar event setting |
| Heft-Neal et al. ED analysis | Shows nonlinear healthcare-use response to smoke intensity, including avoidance at extreme levels | Is not a deployment model for hospital staffing |
| McArdle et al. MMWR surveillance | Shows smoke-associated asthma ED visit increases during 2023 Canadian wildfire smoke episodes | Is not an AI or machine learning validation study |
R² deserves careful handling here. An R² of 0.69 indicates that the model explained a substantial share of variation in the tested hospitalization series, but it does not show clinical readiness by itself.[1] It does not tell a hospital how calibration behaves at the peak of a smoke episode, whether errors are symmetric around high-burden days, or whether the same architecture would perform in a region with different baseline respiratory disease, hospital access, air conditioning prevalence, or smoke communication behavior.
The comparison with ARIMA and NNETAR is still useful. ARIMA represents a conventional statistical time-series baseline; NNETAR represents a neural-network autoregression baseline. Beating both suggests that the hybrid design captured more of the relevant structure in this case than either a standard autoregressive model or a generic neural-network time-series model.[1] That is a meaningful modeling result. It is not the same as evidence that a health system should let the forecast trigger staffing, transfers, or public messaging without human review.
The geography is the main restraint. The health-outcome model evidence remains California-bound, and the Camp Fire is an event-specific test. A model trained and evaluated in that context may learn patterns of care-seeking, coding, baseline air quality, public warnings, and hospital capacity that do not travel cleanly. External validity is not a polish item to add after the model works; it is the condition under which a forecast becomes trustworthy outside the dataset that made it look good.
Extreme Smoke Can Distort the Outcome Signal
Heft-Neal et al. are essential because they show that healthcare utilization is not a passive meter of illness. Using 127 million ED visits across California from 2006 through 2017, the study found a nonlinear response to wildfire smoke exposure.[2] Low-to-moderate smoke increased total ED visits by 1% to 1.5%, but extreme smoke days above 50 μg/m³ PM2.5 were associated with a 6% to 9% decline in total ED visits.[2]
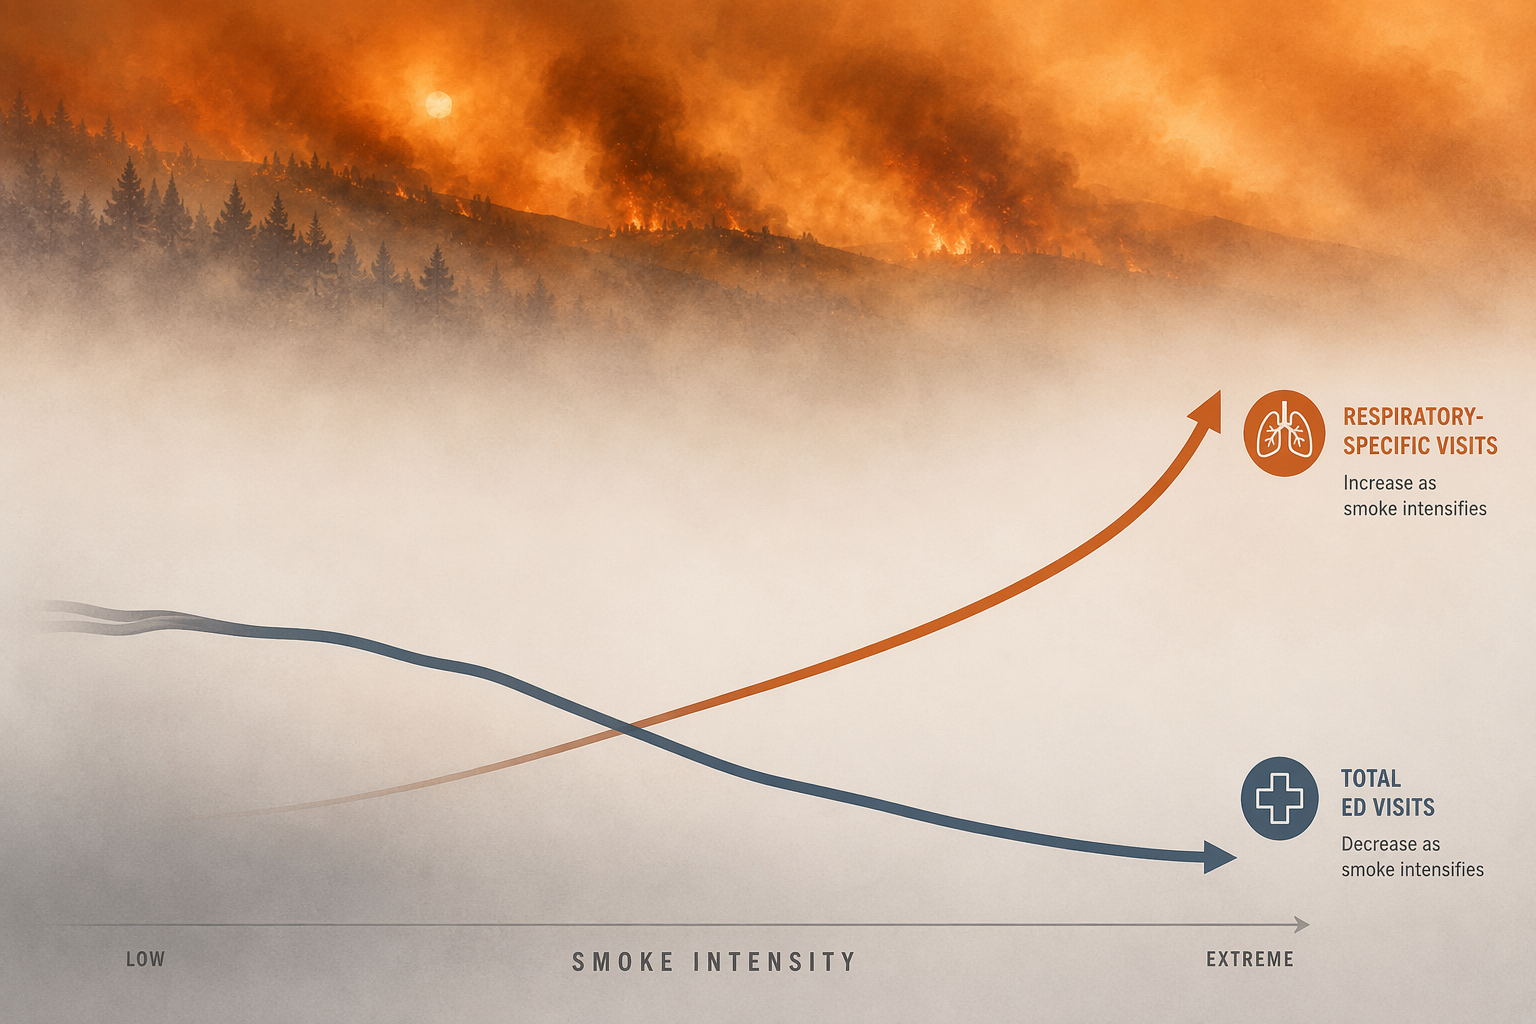
That decline would be easy to misread if total ED visits were treated as a direct health-impact measure. The same study found respiratory-specific visits for asthma, COPD, and cough increased by 30% to 110% during extreme smoke conditions.[2] The most coherent interpretation is not that extreme smoke becomes protective for overall health. It is that people change behavior during severe smoke: they may avoid travel, defer care, follow warnings to stay indoors, or face practical barriers to reaching care, while respiratory morbidity still rises among those whose symptoms force contact with the system.
This finding complicates any model that uses observed utilization as the target. If total ED counts drop on the dirtiest days, a model can appear to learn a negative association between smoke and utilization even while disease burden is increasing in selected categories. If respiratory-specific visits rise sharply, a category-specific model may better capture clinical strain but still miss people who stayed home, used telehealth, went to urgent care, or delayed care until after the smoke episode.
For forecasting, the endpoint definition becomes a methodological decision with operational consequences. Total ED visits may be relevant for whole-hospital flow, but it is confounded by avoidance behavior at extreme concentrations. Respiratory ED visits or respiratory hospitalizations are closer to the smoke-sensitive clinical pathway, but they do not measure the full population burden. Cardiovascular endpoints add another layer because smoke-related risk may emerge through different lags and care pathways than asthma or COPD.
A clean model diagram usually places exposure on the left and visits on the right. Heft-Neal et al. put a behavioral filter between them.[2] During ordinary smoke conditions, that filter may be less visible. During extreme smoke, it can dominate the observed utilization pattern. Any forecast that ignores this mechanism risks predicting the healthcare system's measured contact with patients rather than the underlying health impact of the plume.
National Surveillance Shows the Operational Stakes
The 2023 Canadian wildfire smoke episodes moved the smoke-health forecasting problem into a broader operational frame. McArdle et al., using CDC MMWR surveillance, reported that asthma-associated ED visits across the United States were 17% higher than expected over 19 smoke days.[4] Regions 2, 3, and 5 had PM2.5 peaks of 204 to 259 μg/m³ and the largest excess visit counts.[4]
That analysis is not evidence that an AI model successfully forecast national asthma ED demand. It is evidence that smoke-attributable respiratory utilization can emerge across multiple regions quickly enough to matter for public health surveillance and hospital situational awareness. It also highlights the external-validity problem for California-trained models: smoke episodes in the Northeast or Midwest may involve different housing stock, warning experience, baseline asthma patterns, clinical access, and public expectations than repeated wildfire smoke seasons in the West.
The operational user in that setting is not asking for a perfect causal estimate. They may need to know whether asthma visits are likely to run above baseline tomorrow, whether respiratory staffing should be watched more closely, or whether surveillance analysts should stratify by age, region, and diagnosis. Imperfect early warning can be useful. The problem is deciding which actions are proportionate to the evidence and which require a validated decision tool.
What the Models Are Ready to Support
The strongest current use case is situational awareness. Exposure models can show where wildfire-specific PM2.5 is likely to concentrate. A hospitalization forecast can estimate expected respiratory burden against a counterfactual baseline. ED surveillance can show whether observed visits are diverging from expectation. Interpreted together, these tools can help public health teams decide where to look, what to monitor, and which forecasts deserve manual review.
They are less ready for autonomous operational decisions. A model that estimates 92 excess respiratory hospitalizations during a major smoke event is clinically meaningful, but the same result does not establish that the model can safely determine staffing thresholds in another county.[1] A national surveillance signal showing asthma-associated ED visits above expectation supports preparedness, but it does not validate a predictive algorithm for local command-center use.[4]
Four gaps matter most before these systems can be treated as decision tools rather than decision inputs. First, the health-outcome machine learning evidence has not been prospectively validated outside California. Second, modeled exposure uncertainty is not fully propagated into health forecasts. Third, extreme-smoke behavioral avoidance can invert total-utilization signals while respiratory-specific burden rises. Fourth, the studies reviewed here do not establish a regulatory pathway or clearance framework for AI wildfire smoke health forecasting tools.
That does not make the models weak. It makes their role narrower. The evidence supports using AI and hybrid statistical-machine learning approaches to improve smoke-health situational awareness, guide research planning, and prioritize surveillance attention. It does not support letting a forecast act alone on hospital operations, public health warnings, or resource allocation without local validation, uncertainty review, and human accountability.
References
- Forecasting and Estimating Health Impacts of the 2018 Camp Fire Using Machine Learning: A Case Study in California, American Journal of Epidemiology, 2025
- Nonlinear exposure-response functions and public health impacts of wildfire smoke exposure in California, PNAS, 2023
- Daily Local-Level Estimates of Ambient Wildfire Smoke PM2.5 for the Contiguous US, Environmental Science & Technology, 2022
- Asthma-Associated Emergency Department Visits During the Canadian Wildfire Smoke Episodes — United States, April–August 2023, CDC MMWR, 2023
Comments
Join the discussion with an anonymous comment.