
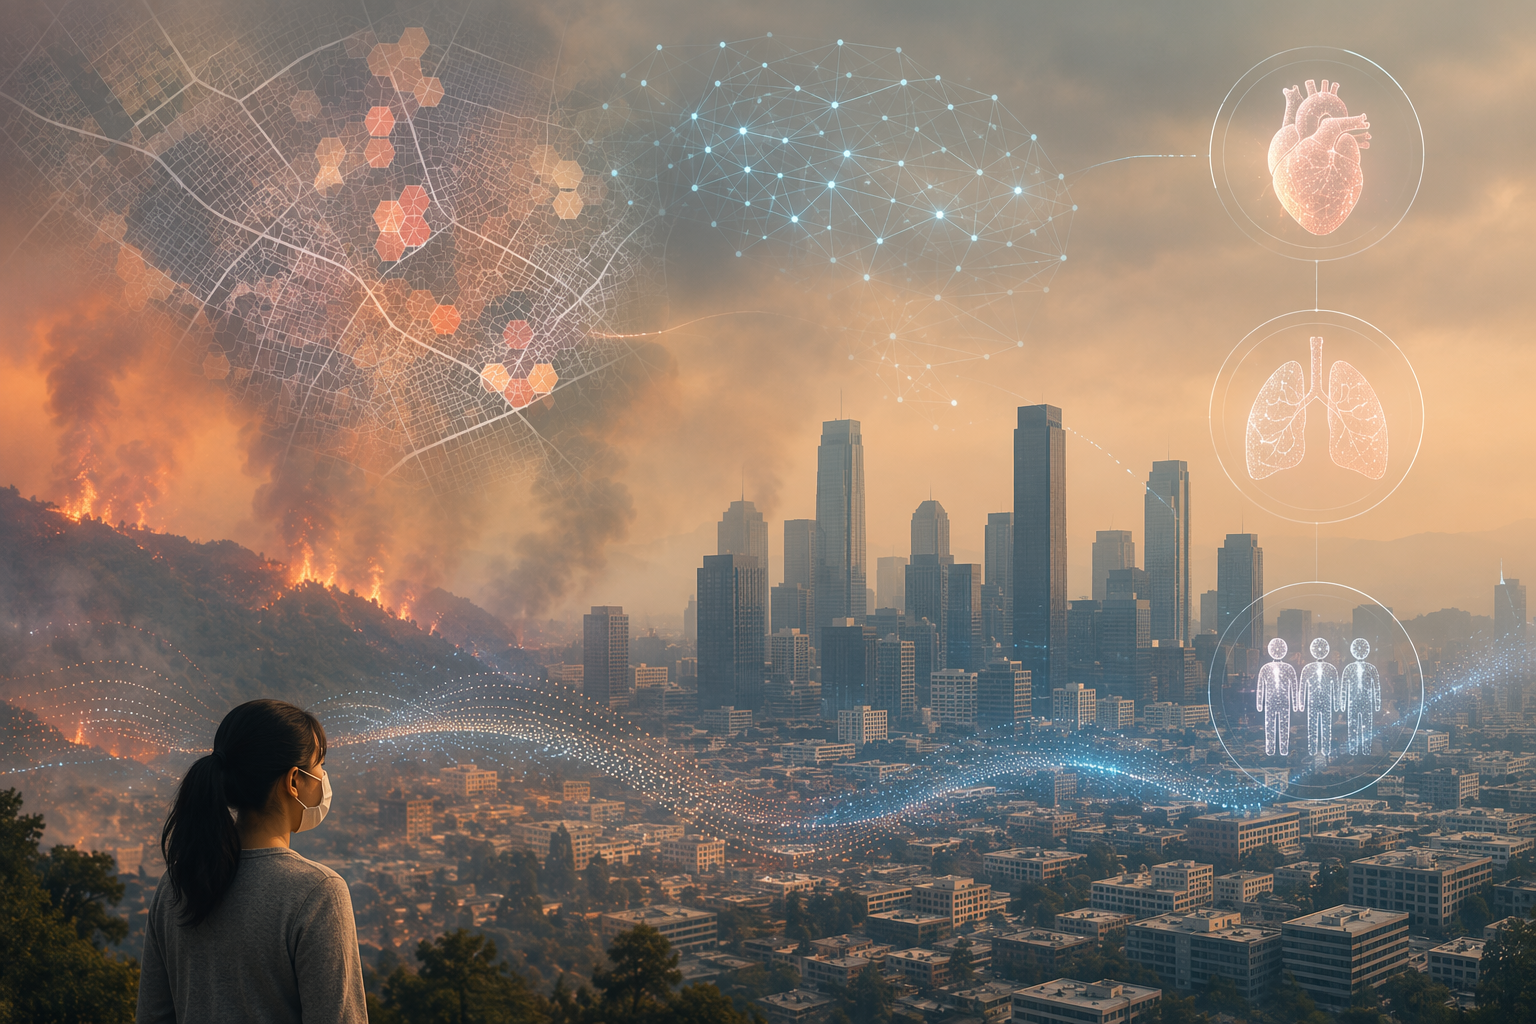
Assessing health risks from wildfire smoke in cities starts with a less glamorous problem than diagnosis: estimating what people were actually exposed to. A hospital can see asthma exacerbations, chest pain, anxiety, or medication disruptions after smoke arrives, but the exposure field that connects those outcomes to a plume is usually incomplete. Ground monitors are sparse, satellites see smoke but not patients, and county health departments need a time and place attached to the risk before they can decide whether to warn older residents, prepare cooling-center filtration, or ask clinical partners to watch for specific conditions.
The important distinction is between two tasks that are often blended together. One task estimates past or current population exposure and links it to health burden. The other forecasts near-future smoke conditions so agencies can act before the exposure peaks. Both can use machine learning. Neither turns a smoky map into patient-level clinical decision support by itself.
The exposure layer: turning smoke into daily PM2.5 estimates
The load-bearing dataset in this literature is the Stanford-led model published by Childs and colleagues in 2022. It produced daily estimates of wildfire smoke PM2.5 at 10 km resolution across the contiguous United States, using machine learning to combine satellite information, ground monitoring, meteorology, and other inputs into a gridded exposure product.[1]
That resolution matters because urban health risk is not assessed at the scale of a national smoke map. Health departments need daily values that can be aggregated to counties, compared across neighborhoods or service areas, and matched to mortality or utilization records. A daily 10 km smoke PM2.5 estimate is still coarse for a patient standing beside a roadway, but it is much closer to a usable public-health exposure surface than a plume outline.
The model’s validation result should stay visible: Childs et al. reported R²=0.67 when comparing the smoke PM2.5 estimates against station measurements.[1] That is meaningful performance for reconstructing exposure over large areas and long time periods. It is not a license to treat every grid-cell value as ground truth. An R² at that level leaves enough residual error that the model is better understood as an exposure estimate for population research and planning, not as a direct measurement at the curb, school entrance, or clinic door.
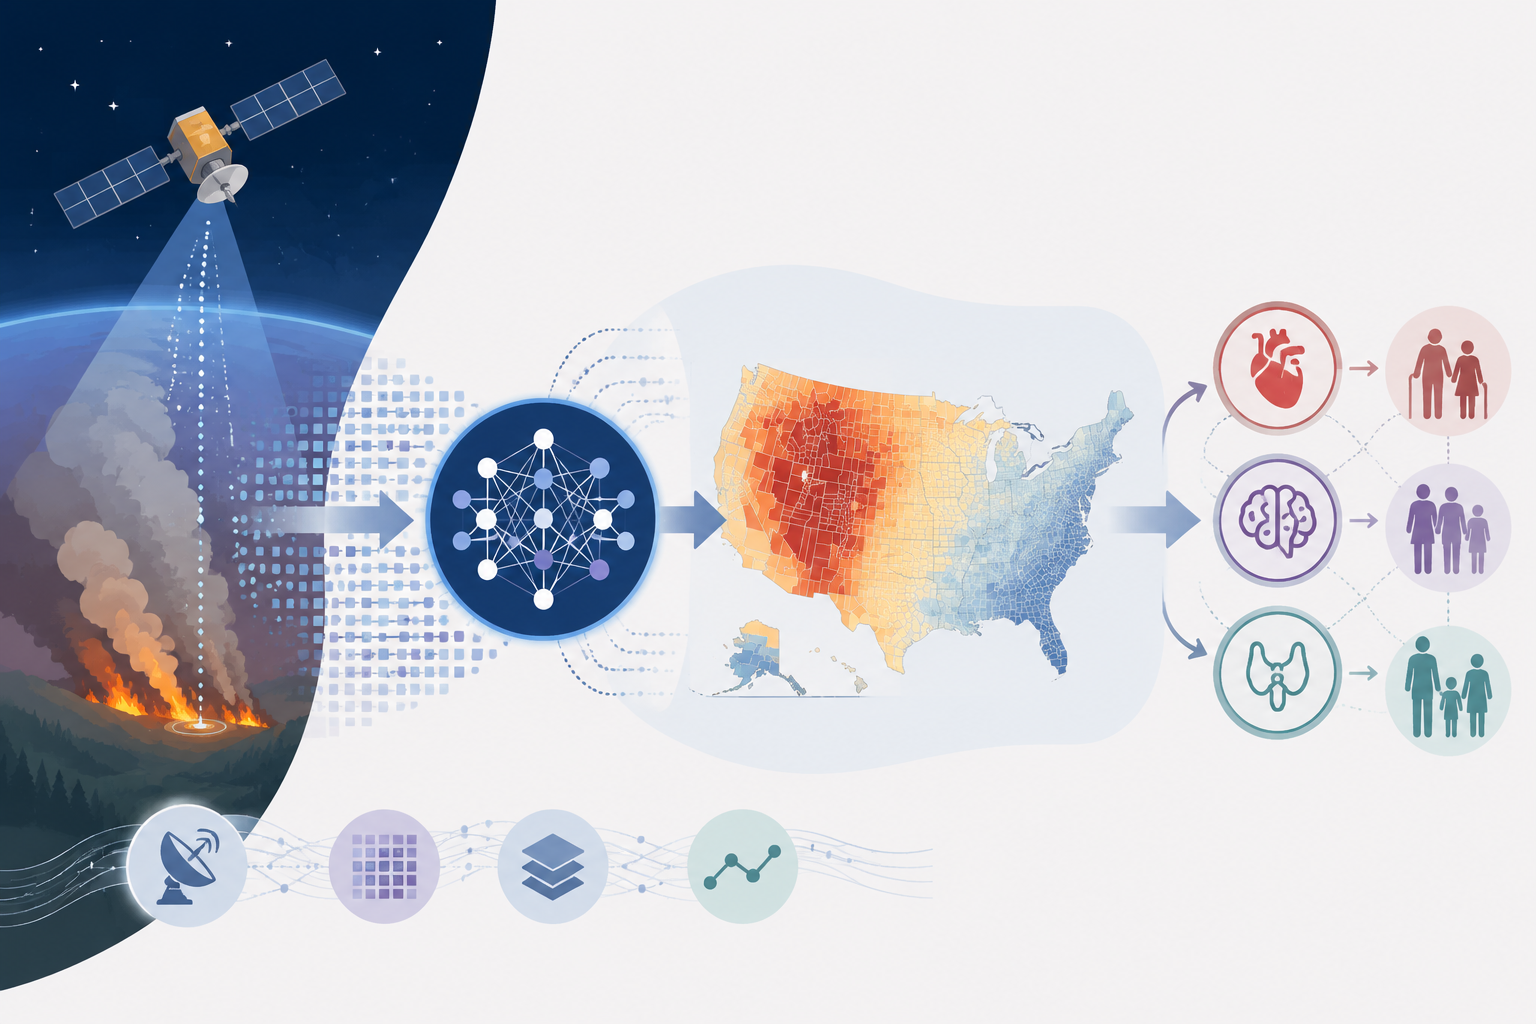
This is where AI contributes something concrete. It fills gaps between monitors, adds spatial continuity, and separates wildfire smoke PM2.5 from broader ambient particulate pollution well enough to support epidemiologic analysis. The caution is equally concrete: the output is modeled exposure. Any later health estimate inherits that uncertainty.
| Question | What the AI model contributes | What it does not settle |
|---|---|---|
| Where and when was smoke PM2.5 elevated? | Daily 10 km estimates across the contiguous U.S. | Exact exposure for a person, room, or clinical encounter |
| Can the estimates support population research? | A validated exposure surface that can be linked to county-level outcomes | Individual-level causation |
| Can agencies use the estimates operationally? | A consistent historical and current-risk layer for planning | A definitive clinical risk score |
From modeled exposure to mortality burden
The next step is not simply adding a health icon to the map. Ma and colleagues used the AI-derived smoke PM2.5 estimates to study cause-specific mortality across 3,108 counties in the contiguous United States. Their 2024 PNAS analysis estimated about 11,415 annual nonaccidental deaths attributable to wildfire smoke PM2.5.[2]
The cause-specific results make the burden less abstract. The study estimated 4,512 cardiovascular deaths per year, 2,083 deaths from mental disorders, and 1,142 deaths from endocrine diseases attributable to smoke PM2.5.[2] Those categories matter for planning because they point to different parts of the health system: emergency cardiac care, behavioral health outreach, chronic disease management, pharmacy continuity, and risk communication for people whose baseline conditions can worsen during smoke events.
The demographic findings are just as important as the total. Ma et al. reported stronger effects among elderly, Black, and Hispanic populations.[2] For a local health department, that does not mean the model can identify which individual resident will die after a smoky week. It means smoke planning should not be population-neutral if the burden is not population-neutral. Outreach lists, language access, cooling and clean-air shelter siting, and clinical messaging all become part of the risk assessment, not an optional equity appendix.
The study design also sets a boundary. Ma et al. conducted an ecological analysis, which is powerful for estimating population burden but cannot prove individual-level causation.[2] That distinction is not academic housekeeping. If a clinician asks whether a specific patient’s arrhythmia was caused by smoke, this evidence cannot answer that question. If a county asks whether smoke PM2.5 is associated with a measurable mortality burden large enough to justify targeted warnings and preparedness, the evidence is much more relevant.
Forecasting before the plume arrives
Retrospective exposure models help explain burden. Forecasting models try to reduce it. Yu and colleagues at Penn State approached a different operational problem during the June 2023 Canadian wildfire smoke events affecting New York City and Philadelphia: how to improve atmospheric PM2.5 forecasts when smoke is moving through dense urban populations.[3]
Their deep learning refinement of WRF-Chem substantially corrected forecast bias. Penn State reported that PM2.5 error improved from -6.872 to +0.160 µg/m³.[3] That kind of shift is operationally meaningful because underprediction can delay warnings, while overprediction can fatigue the public and strain already limited staff attention.
The same reported work also examined mobility behavior during the events in New York City and Philadelphia.[3] That is a useful reminder that exposure is not only an atmospheric quantity. People move, commute, shelter, work outdoors, open windows, or lack access to filtered indoor air. Forecasting smoke concentration is necessary, but the health-risk question also depends on who remains exposed and who has the resources to change behavior.
| Use case | Evidence in the current literature | Appropriate interpretation |
|---|---|---|
| Historical exposure assessment | Daily 10 km smoke PM2.5 estimates across the contiguous U.S. | Useful for population studies and public-health planning, with model uncertainty |
| Mortality burden estimation | County-level cause-specific mortality analysis across 3,108 counties | Supports population-level burden and prioritization, not individual causation |
| Short-term urban forecasting | Deep learning refinement of WRF-Chem during June 2023 smoke events | Can improve warning lead time and forecast accuracy in studied events |
Newer systems are moving toward operations, with thinner evidence
The research is no longer confined to retrospective studies. CIRES and NOAA described an AI system in January 2026 that combines seven global fire-emission inventories to predict wildfire emissions 35 to 45 days in advance. The system was trained on four years of meteorological, vegetation, and fire radiative power data.[4]
That is an ambitious forecasting target, especially for health agencies that would benefit from more time to prepare staffing, communications, and clean-air resources. But the evidentiary status is different from the peer-reviewed exposure and mortality studies. The CIRES/NOAA work was described as conference-presented research, so it should be treated as a technical development rather than settled validation for public-health deployment.[4]
Commercial tools show the same shift toward institutional use. The University of Utah’s Trace AQ tool uses the EPA CMAQ model with machine-learning augmentation, offers free one-day smoke forecasts and subscription four-day forecasts, and was commercialized with $1.25 million in seed funding.[5] That matters because agencies and private organizations are evidently looking for products they can run before and during smoke events.
Commercialization does not establish clinical validity. Trace AQ may be useful for operational smoke awareness, and tools like it may help institutions standardize forecasting workflows. But the materials available here do not show FDA clearance or any equivalent regulatory status for clinical decision support. A forecast can support public-health messaging without becoming a medical device.
Why the pressure to use these tools is increasing
The pressure on these methods is not theoretical. Stanford’s sustainability overview noted a 27-fold increase in U.S. wildfire smoke exposure over a decade.[6] That figure helps explain why public agencies are interested in AI-supported exposure and forecasting systems: the monitoring and response infrastructure built for more ordinary air-quality problems is being asked to handle repeated regional smoke incursions.
Still, the available evidence is heavily U.S.-centered, especially around the contiguous United States. Models trained and validated in that setting may not transfer cleanly to regions with different fire regimes, fuel types, topography, satellite retrieval conditions, monitor density, building stock, or health-system capacity. Geographic generalizability has to be demonstrated, not assumed.
What public-health users can responsibly take from the evidence
For health departments, emergency planners, and clinical leaders, the current evidence supports a practical but bounded use case. AI can estimate wildfire smoke exposure across cities and counties, link that exposure to population-level mortality burden, and improve PM2.5 forecasts during smoke events. Those are real capabilities, and they are already close enough to operations to affect warning systems and preparedness planning.
The same evidence does not support a stronger claim. The Childs exposure surface is moderately validated rather than definitive. The Ma mortality estimates are ecological rather than individual. The Penn State forecast improvement is tied to studied urban smoke events. The CIRES/NOAA system is promising but not yet equivalent to a mature peer-reviewed public-health tool. Trace AQ shows deployment demand, not clinical regulatory clearance.
The right question, then, is not whether AI can assess health risks from wildfire smoke in cities. It can, if assessment means estimating exposure fields, quantifying population burden, and improving forecasts. The harder question is whether a specific model is validated for the decision being made: a county warning, a hospital staffing plan, a targeted outreach campaign, or a clinical recommendation. That is where traceability, resolution, uncertainty, and study design still decide how far the model should be allowed to travel.
References
- Daily Local-Level Estimates of Ambient Wildfire Smoke PM2.5 for the Contiguous US, Environmental Science & Technology, 2022.
- Long-term exposure to wildland fire smoke PM2.5 and mortality in the contiguous United States, PNAS, 2024.
- Improved wildfire smoke model identifies areas for public health intervention, Penn State.
- Artificial intelligence takes wildfire emissions to new frontier in forecasting, CIRES, January 2026.
- U scientists develop AI-powered tool to forecast wildfire smoke, University of Utah.
- Wildfire smoke is unraveling decades of air quality gains, Stanford Sustainability.
Comments
Join the discussion with an anonymous comment.