
The July 17, 2026 Code Purple notice for the Washington, DC region matters because it names a specific exposure band, not a general mood about bad air. Code Purple corresponds to an Air Quality Index of 201–300, the EPA’s “Very Unhealthy” category; it is separate from the maroon “Hazardous” category at AQI 301 and above.[1][2] That distinction is clinically useful. At AQI 201–300, the question is no longer whether sensitive patients might notice symptoms. The question is how quickly respiratory and cardiovascular utilization rises, which patients are likely to arrive first, and how much cumulative exposure is being added to people who already carry a higher baseline burden.
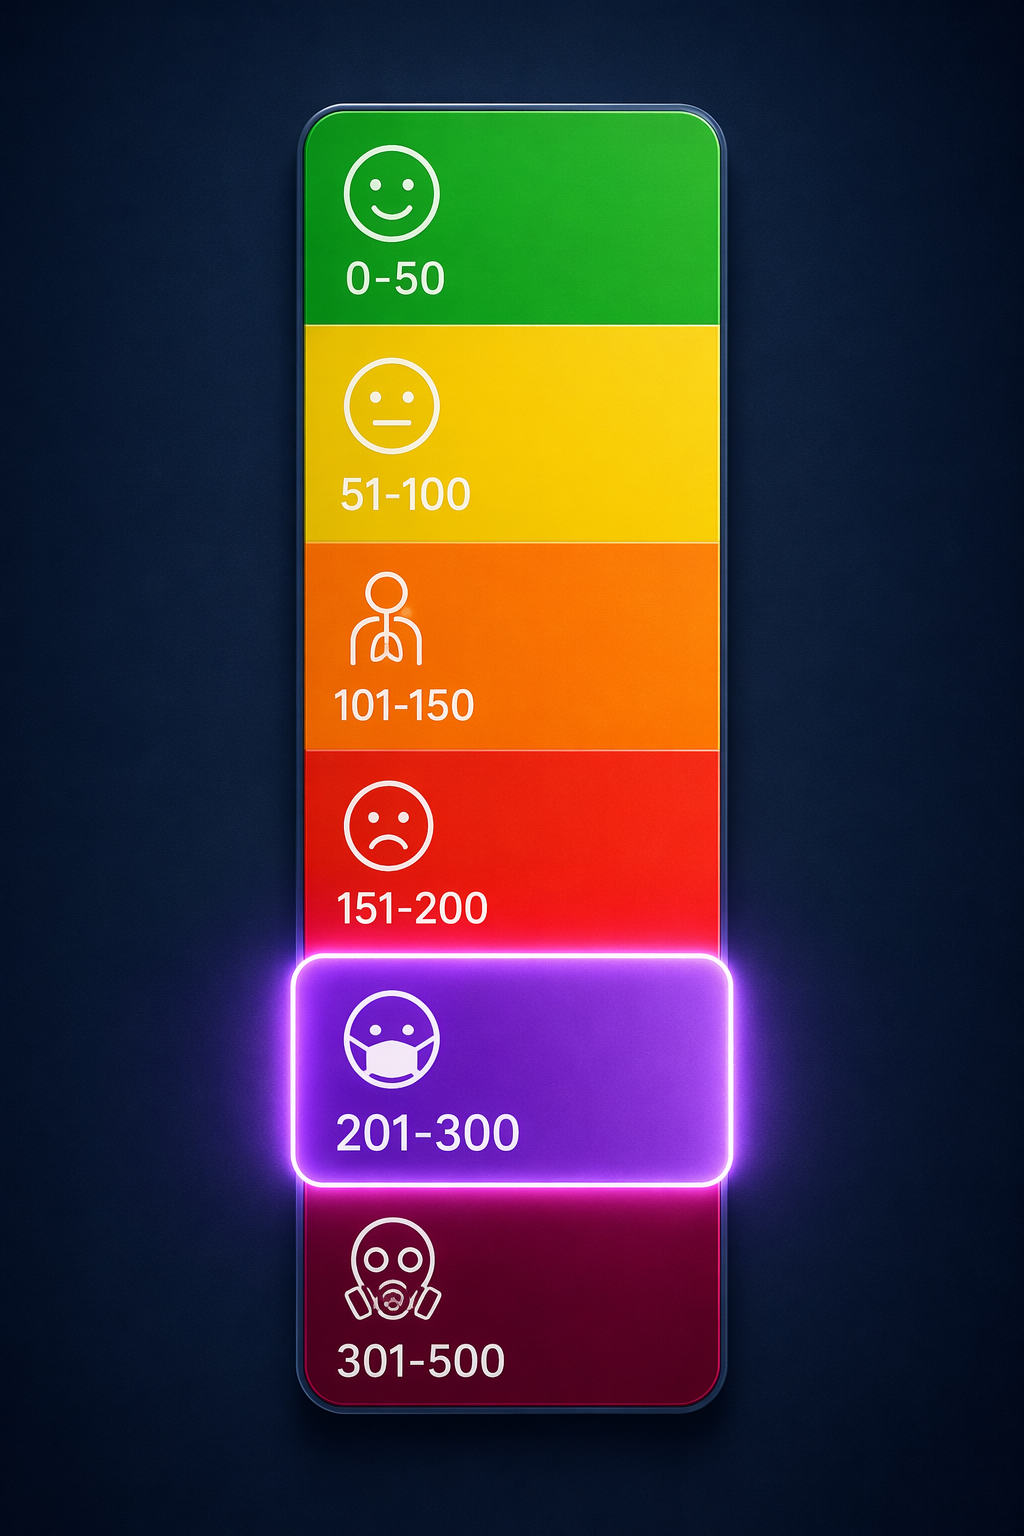
The health risks of Code Purple air quality are best read as a concentration-dependent, multisystem signal. The acute signal appears within hours to days in emergency departments and hospital admissions. The chronic signal accumulates through repeated particulate exposure, especially PM2.5, and is visible in mortality, cardiopulmonary disease, neurodevelopmental outcomes, and pregnancy outcomes. The cleanest evidence is not one dramatic study; it is the convergence of several imperfect but directionally consistent literatures.
Code Purple Is a Measured Inflection Point, Not a Synonym for “Bad Air”
AQI categories compress several pollutants into a public-facing scale, so clinicians should avoid treating the color as if it were a diagnosis. The clinical interpretation depends on the pollutant driving the index, the duration of exposure, indoor penetration, heat, activity level, and patient susceptibility. Still, AQI 201–300 is not arbitrary. It marks a range where population-level effects become easier to detect because exposure intensity is high enough for small individual risks to become visible across large groups.
That is why imprecision around Code Purple can be harmful. Calling it “hazardous” may sound more urgent, but it collapses the EPA’s Very Unhealthy and Hazardous categories and can obscure thresholds used in public messaging, school decisions, occupational planning, and clinical triage. Understating it as merely “poor air quality” does the opposite: it hides a risk band where patients with asthma, coronary disease, pregnancy, advanced age, and outdoor work exposures may need anticipatory action rather than reassurance.
The First Clinical Signal Is Respiratory
The most directly actionable evidence concerns asthma and respiratory visits. A 2025 systematic review of 78 studies, covering more than 40 million individuals, found that each 10-unit AQI increase corresponded to a 1.5%–3.2% increase in asthma emergency department visits across multiple cities.[3] The journal placement warrants caution; this is not the kind of single source that should carry the whole argument. But the estimate is clinically plausible and aligns with stronger population datasets showing increased respiratory utilization during high-PM smoke events.
The California wildfire-smoke analysis in GeoHealth is especially useful because it translates exposure into hospital workload. Using six years of hospital data and roughly 63,684 annual visits, the study defined smoke event days as days when cumulative wildfire PM2.5 reached at least the 98th percentile. Those days were associated with a 3.3% increase in all-respiratory hospital visits and a 10.3% increase in asthma hospital visits.[4] For children aged 0–5, the asthma increase was 10.8%, the largest pediatric effect reported in the analysis.[4]
Those percentages can look modest until they are placed in an emergency department. A 3% respiratory increase across a metropolitan region is not one extra cough. It is more triage, more nebulized bronchodilators, more observation time, more steroid decisions, more return precautions, and more families deciding whether a preschool child is breathing fast enough to go back to the hospital. A 10% asthma-visit increase among the youngest children is a pediatric operations issue, not just an environmental statistic.
The mechanism does not need to be overdecorated. Fine particles penetrate deeply into the respiratory tract, provoking airway irritation, oxidative stress, and inflammatory signaling. In patients with asthma or chronic obstructive pulmonary disease, that added inflammatory load can narrow the margin between controlled disease and an urgent visit. The same mechanism also helps explain why exercise, outdoor work, and heat can make exposure more consequential: higher ventilation increases delivered dose.
A single-center PLOS ONE study from Chiang Mai, Thailand, adds a shorter-term emergency department signal, reporting a same-day pneumonia ED relative risk of 1.071 associated with AQI exposure.[5] Its limits are clear: one center, one year, a different geography, and a different exposure mix. It should not be generalized as if it were a national US estimate. Its value is narrower but still useful: it points in the same direction as larger studies, with acute respiratory visits rising close to exposure days rather than only after prolonged accumulation.
Cardiovascular Effects Arrive on a Slightly Different Clock
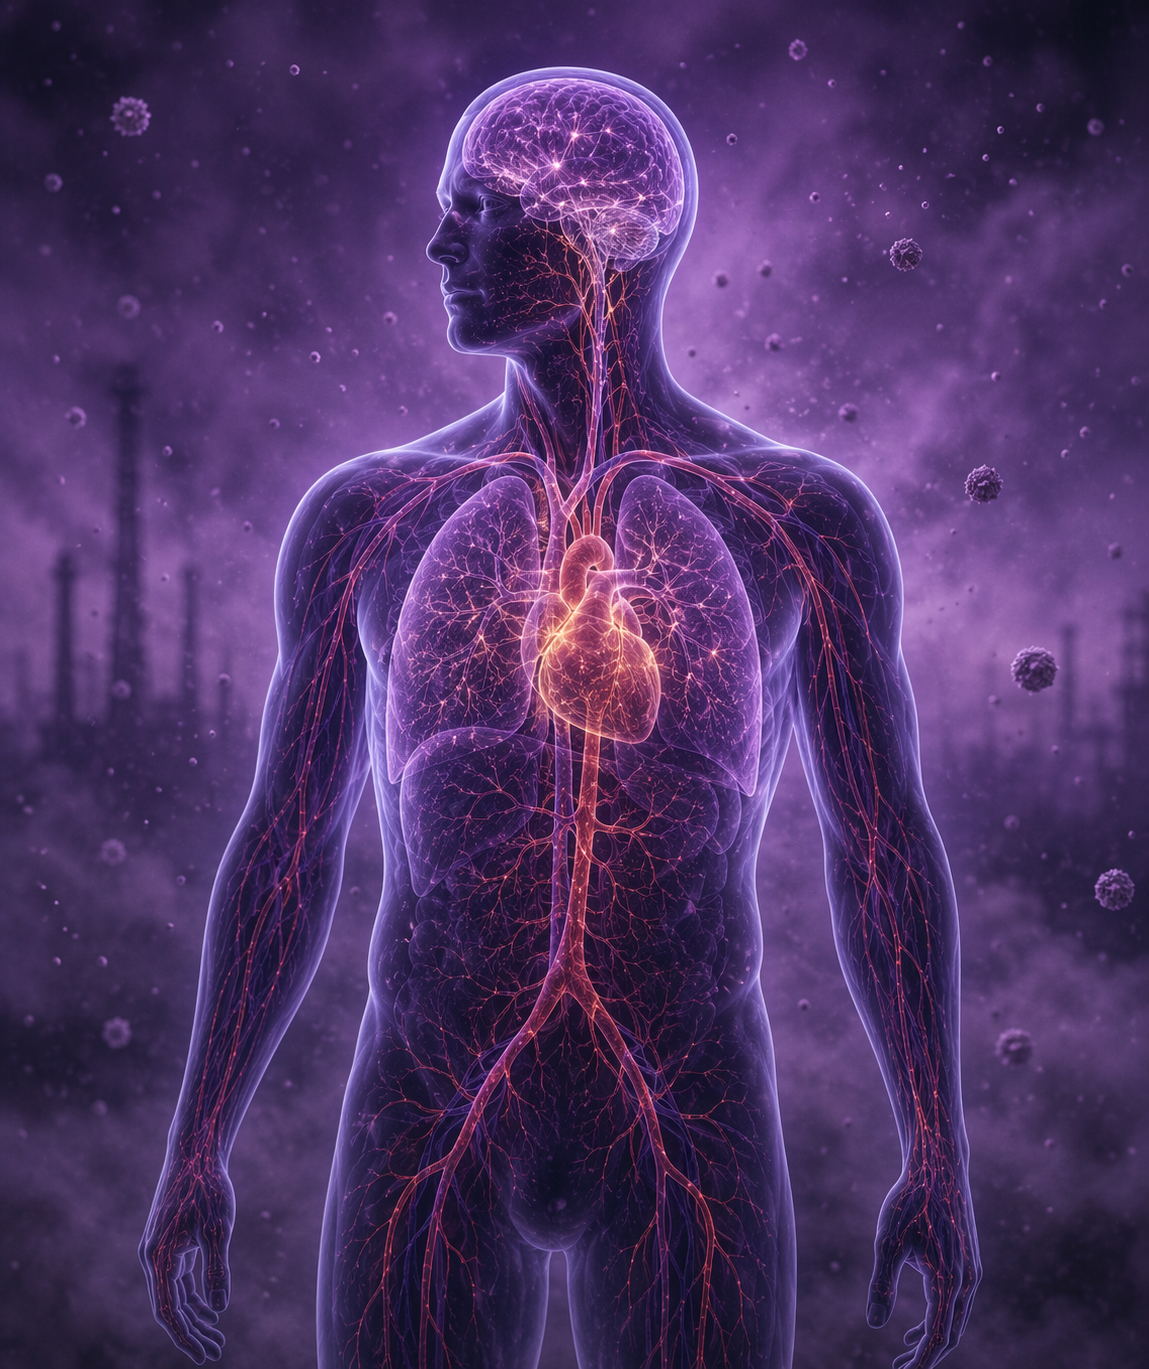
The cardiovascular signal is less visible to the public than wheezing, but it is at least as important clinically. In the California GeoHealth study, short-term PM2.5 exposure elevated acute coronary syndrome emergency department visits, with relative risks of 1.023–1.026 on lag days 1–2.[4] The lag matters. A Code Purple day may not only increase same-day respiratory complaints; it may also shift coronary events into the following one to two days, when the public conversation has already moved on.
The Chiang Mai PLOS ONE study reported increased acute coronary syndrome mortality risk three days after exposure, with an odds ratio of 1.36.[5] Again, the study’s single-center design limits generalizability. But the temporal pattern is coherent with what clinicians already know about triggers: particulate exposure can promote systemic inflammation, autonomic imbalance, endothelial dysfunction, and thrombogenic conditions in people whose coronary disease may have been clinically quiet the day before.
Heat complicates the picture. On smoke event days in the California analysis, cardiovascular visits increased 1.0% per 5°C temperature rise, evidence of heat–smoke synergy rather than two isolated hazards operating side by side.[4] That is not a small operational detail during summer air-quality events. Older adults, people taking diuretics or beta blockers, patients with heart failure, and outdoor workers may experience heat strain and particulate exposure as one combined physiologic insult.
Chronic cardiovascular evidence widens the frame beyond the ED. NIEHS summaries and broader reviews associate long-term PM2.5 exposure with cardiovascular mortality, while published syntheses report 20%–35% higher cardiovascular mortality and 15%–28% increased COPD mortality with long-term PM2.5 exposure.[6][7] Those figures should not be read as the effect of one Code Purple afternoon. They describe the cumulative risk architecture into which each severe episode is added.
The Dose-Response Anchor: Mortality Rises as PM2.5 Accumulates
For population health interpretation, the central anchor is the dose-response relationship. The National Academy of Medicine summary reports that sustained PM2.5 exposure is associated with a 5%–12% increase in all-cause mortality per 10 μg/m³ PM2.5.[8] That estimate is not a Code Purple-only estimate, and it should not be presented as if every exposed person’s immediate mortality risk rises by that amount during a single alert. It is a cumulative exposure estimate, and that is exactly why repeated severe-air days matter.
Dose-response evidence also prevents a common public-health mistake: treating AQI thresholds as if risk appears only after a color changes. Risk does not begin at purple. Sustained exposure above AQI 150 already carries concern, and risk continues to rise with dose. Code Purple is a practical inflection point because the concentration range is high enough that immediate utilization effects and cumulative burden become difficult to dismiss.
The Risk Field Extends Beyond Lungs and Coronaries
Neurological, metabolic, reproductive, and carcinogenic outcomes require more careful phrasing than asthma visits or ACS lags because the causal pathways are harder to isolate and the time horizons are longer. The evidence is still consequential. NIEHS summarizes associations between air pollution exposure and neurodevelopmental outcomes, including prenatal PM2.5 exposure during the third trimester being associated with up to a twofold autism risk.[6] That should be read as an association in a vulnerable developmental window, not as a deterministic claim about any individual pregnancy exposed during a Code Purple event.
Pregnancy outcomes follow the same cautious logic. NIEHS summaries link air pollution exposure with preterm birth, low birth weight, and later childhood hypertension.[6] These outcomes are not emergency-department utilization signals, and they should not be used to frighten pregnant patients with false precision. They do mean that public-health advice during severe PM2.5 episodes should treat pregnancy as a clinically relevant susceptibility state, not as an afterthought.
The mechanistic bridge across organ systems is not mysterious. Reviews describe oxidative stress, inflammation, and epigenetic reprogramming as pathways by which air pollution can affect respiratory, cardiovascular, neurological, reproductive, and metabolic systems.[7] Mechanism alone does not prove clinical magnitude, but it helps explain why the epidemiology does not stay inside one organ system.
Carcinogenicity belongs in the chronic-risk column. PM2.5 is classified as a Group 1 human carcinogen by IARC/WHO, and the National Academy of Medicine summary reports that coal-derived PM2.5 carries approximately twice the mortality risk of all-source PM2.5.[6][8] That differential is a reminder that equal mass does not always mean equal toxicity. AQI is useful for public communication, but it cannot fully encode source composition, particle chemistry, or the social conditions that determine who keeps breathing the exposure.
Unequal Exposure Changes the Meaning of Population Risk
Averaged risk estimates are necessary, but they can flatten the people most likely to be harmed. GeoHealth race-stratified analyses and environmental-justice summaries report that Black and Hispanic Americans face 56% and 63% more PM exposure than they produce, respectively.[4] That is not merely an inequity statement appended to the clinical science. If exposure is higher and baseline cardiopulmonary burden is unevenly distributed, the same regional AQI category does not translate into the same lived dose or downstream risk.
Occupation makes the same point in a different way. In California agricultural regions, 93% of outdoor workers are Latinx.[8] “Stay indoors” is a different intervention for a remote worker with filtered air than for a farmworker, construction worker, delivery driver, or groundskeeper whose paycheck depends on outdoor labor. Clinicians who ask only whether a patient has an air purifier may miss the exposure source that matters most: the hours they are required to spend outside.
Children aged 0–5 with asthma, older adults with coronary disease, pregnant patients, people with COPD or heart failure, and outdoor workers should therefore not be treated as a generic “sensitive groups” box. Their pathways differ. One child’s risk is airway caliber and viral-season overlap; one older adult’s risk is plaque vulnerability and heat strain; one pregnant patient’s risk is a developmental exposure window; one outdoor worker’s risk is prolonged dose with limited control.
What Clinicians Should Take From the Evidence
The strongest acute evidence supports expecting more respiratory visits, especially asthma, during and immediately after high-PM events. The best quantified estimates are the 1.5%–3.2% increase in asthma ED visits per 10-unit AQI rise from the 78-study review and the 10.3% asthma hospital-visit increase during California smoke event days.[3][4] For pediatric services, the 10.8% increase among children aged 0–5 is the estimate that should change staffing attention, discharge counseling, and threshold-of-return conversations.[4]
The cardiovascular evidence supports extending vigilance beyond the alert day. ACS ED visits increased on lag days 1–2 in the California study, and ACS mortality rose three days post-exposure in the Chiang Mai study.[4][5] Those findings do not mean every chest-pain presentation after Code Purple is pollution-caused. They mean recent PM2.5 exposure belongs in the clinical background, particularly for patients with coronary disease, older age, heat exposure, or limited ability to reduce outdoor activity.
The broader multisystem evidence supports classifying Code Purple days as part of cumulative exposure management. Neurological, reproductive, metabolic, carcinogenic, COPD, cardiovascular-mortality, cognitive-decline, and all-cause mortality associations do not all operate on the same clock or with the same evidentiary certainty.[6][7][8] They do, however, point in the same direction: repeated severe PM2.5 exposure is not washed away when the sky clears.
The limitations are real and should stay visible. The 2025 systematic review is large but published in a lower-tier journal; the California GeoHealth study uses 2004–2009 data, before the most severe recent escalation in wildfire intensity; the Chiang Mai PLOS ONE study is single-center and one-year; and Code Purple should not be conflated with Hazardous AQI above 300.[3][4][5][2] Even with those limits, the convergence is strong enough for clinical interpretation: AQI 201–300 is a threshold at which clinicians and public-health professionals should expect immediate utilization effects and unequal cumulative burden, concentrated among children, older adults, pregnant patients, people with cardiopulmonary disease, racial minorities, and outdoor workers.
References
- Code Purple: Notice of Very Unhealthy Air, MWCOG, July 17, 2026.
- AQI Basics, AirNow.gov.
- Short-Term and Long-Term Health Effects of High AQI Exposure: A Systematic Review, European Journal of Cardiovascular Medicine, 2025.
- Impacts of Fine Particulate Matter From Wildfire Smoke on Respiratory and Cardiovascular Health in California, GeoHealth, 2022.
- Association between air quality index and effects on emergency department visits, PLOS ONE, 2023.
- Air Pollution and Your Health, NIEHS.
- Environmental and Health Impacts of Air Pollution: A Review, Frontiers in Public Health, 2020.
- Summary: Health Impacts of Poor Air Quality, National Academy of Medicine, 2025.
Comments
Join the discussion with an anonymous comment.