
The CDC record on norovirus case counts on cruise ships does not move in the direction a casual reader might expect. From 2006 through 2019, acute gastroenteritis incidence on ships under the Vessel Sanitation Program declined substantially: among passengers, from 32.5 to 16.9 cases per 100,000 travel-days; among crew, from 13.5 to 5.2 per 100,000 travel-days.[1] Then cruising resumed after the COVID-19 interruption, and the outbreak count rose sharply. CDC VSP pages list 16 gastrointestinal outbreak investigations in 2024 and 23 in 2025, making 2025 the highest annual total in the 2006–2026 VSP record described here.[2][3]
Both parts of that sentence matter. The long pre-pandemic decline is not a decorative baseline. It is the evidence that the cruise environment, at least as measured through this surveillance system, was not simply drifting toward more gastrointestinal illness year after year. The post-pandemic surge is also too large to dismiss as a few memorable headlines. The useful question is narrower and more demanding: what, exactly, can the CDC surveillance record show, and where does it stop short of measuring the true burden of illness at sea?

The denominator is travel-days, not headlines
The strongest pre-pandemic evidence comes from the CDC’s 14-year analysis of the Maritime Illness Database and Reporting System, covering acute gastroenteritis reports on cruise ships under VSP jurisdiction from 2006 through 2019.[1] That matters because it uses travel-days as the denominator. A ship with thousands of passengers at sea for a week creates a different exposure base from a short voyage with fewer people aboard. Raw case counts alone cannot separate those differences.
In that baseline period, the decline was visible in both passenger and crew rates. Passenger AGE incidence fell from 32.5 to 16.9 cases per 100,000 travel-days, and crew incidence fell from 13.5 to 5.2.[1] Crew trends are especially useful because crew members are not simply a rotating vacation population. They live with ship routines, food systems, cleaning protocols, and medical reporting procedures across repeated voyages. A simultaneous decline in passengers and crew does not prove one intervention caused the change, but it does make the trend harder to explain as passenger behavior alone.
Norovirus dominated the known-cause outbreak picture. In the CDC analysis, it accounted for approximately 90% of cruise ship gastrointestinal outbreaks with a known causative agent.[1] That figure should not be read as “90% of all stomach illness on ships is norovirus,” because surveillance systems do not identify an etiologic agent for every event. It does justify treating norovirus as the main pathogen in this particular outbreak record.
| Measure | What the CDC baseline showed |
|---|---|
| Passenger AGE incidence | Declined from 32.5 to 16.9 cases per 100,000 travel-days, 2006–2019 |
| Crew AGE incidence | Declined from 13.5 to 5.2 cases per 100,000 travel-days, 2006–2019 |
| Known-cause GI outbreaks | Norovirus accounted for approximately 90% |
| Recurring associations | Higher passenger AGE incidence was associated with larger ships and voyages longer than seven days |
The ship-size and voyage-length associations are not surprising, but they are useful. Larger ships concentrate more susceptible people, more shared surfaces, more dining cycles, and more opportunities for person-to-person transmission. Longer voyages give an outbreak more time to become visible before arrival reporting closes. The CDC analysis found higher passenger AGE incidence associated with larger ships and voyages longer than seven days.[1] That is a surveillance finding, not a moral judgment about large ships.
What counts as an outbreak in the VSP record
The CDC VSP outbreak pages are often read as if they were a complete registry of norovirus illness at sea. They are not. VSP posts gastrointestinal outbreak investigations when at least 3% of passengers or 3% of crew report GI symptoms to the ship’s medical staff. That threshold is a practical trigger for investigation and public reporting; it is not a biological boundary between a meaningful and meaningless event.[2]
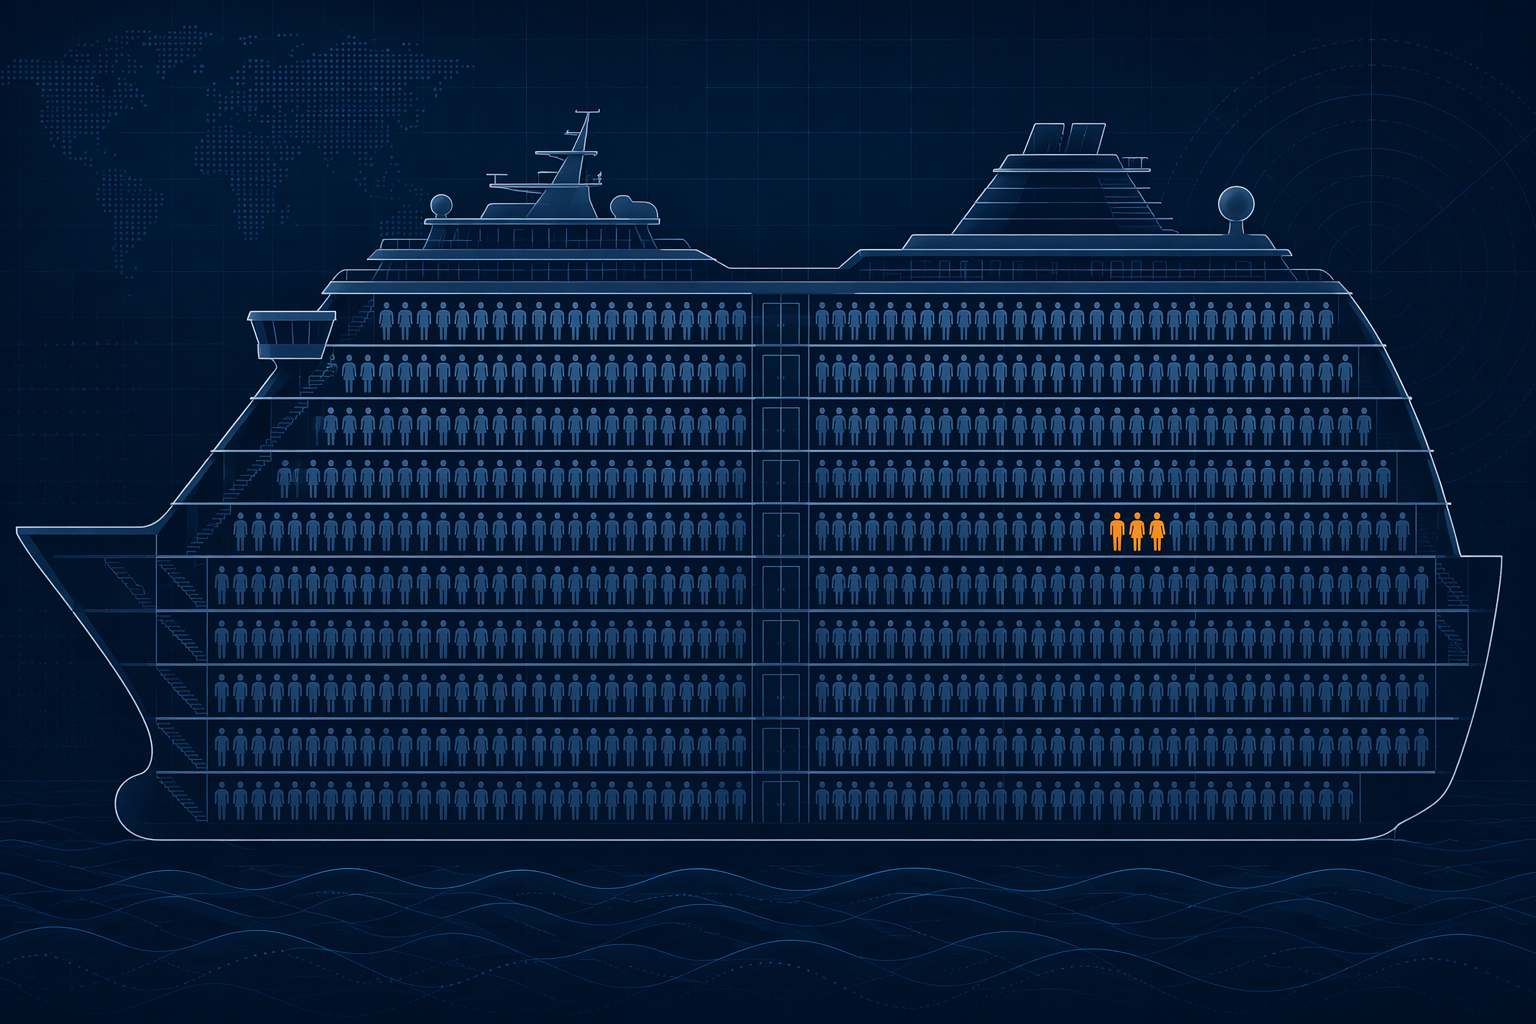
A voyage can have gastrointestinal illness below that threshold and still involve real sick people, extra cleaning, isolation decisions, and medical workload. Those events generally do not appear on the public outbreak pages. Individual cases are also outside the frame. For anyone trying to estimate the full burden of illness, the VSP outbreak count is therefore a floor built from defined reporting rules, not a ceiling.
Jurisdiction narrows the record further. VSP covers cruise ships that carry 100 or more passengers, have itineraries of 3–21 days, and include both U.S. and foreign ports.[1] International-only itineraries and ships outside those criteria are not part of this surveillance universe. The resulting dataset is valuable precisely because it is standardized, but its boundaries must travel with every conclusion drawn from it.
There is also a break in the case definition. The CDC analysis notes that the AGE case definition was broadened in 2011, creating a discontinuity in the trend line.[1] That does not erase the decline from 2006 to 2019, but it does warn against reading the full series as if every year were measured with identical clinical criteria. Surveillance tables rarely offer the kind of smoothness readers want from them.
The post-COVID surge is visible even with those limits
After the COVID-19 disruption, the VSP outbreak pages show a sharp change in the public record. The 2024 count reached 16 gastrointestinal outbreak investigations, the highest annual total since 2012 in the VSP series summarized here.[3] In 2025, the count rose again to 23, exceeding the previous annual totals in the 2006–2026 dataset.[2]
This is where the temptation to over-explain becomes strongest. The data support saying that reported VSP gastrointestinal outbreaks increased sharply after cruising resumed. They do not, by themselves, prove that ships became dirtier, passengers became less careful, or one viral genotype caused the cruise surge. The outbreak pages count events that crossed a reporting threshold within a defined jurisdiction. They do not contain every exposure pathway needed to assign cause.
Still, the 2025 number deserves attention because it is not a small wobble around the pre-pandemic baseline. A record annual outbreak count in a long-running surveillance system is the kind of signal that should survive some irritation about imperfect measurement. The appropriate response is not panic; it is to ask which surrounding evidence makes the signal more or less plausible.
GII.17 belongs beside the cruise trend, not on top of it
One plausible piece of context is the rise of norovirus GII.17 in U.S. outbreak surveillance. Published NoroSTAT-based research reported that GII.17 rose from less than 10% of genotyped U.S. norovirus outbreaks in 2022–23 to about 75% in 2024–25.[4] That timing overlaps with the cruise outbreak surge, and CDC has stated that ships typically follow the pattern of land-based outbreaks.[4]
The overlap is important; it is not sufficient. The GII.17 dominance data come primarily from land-based NoroSTAT surveillance networks, not from a comprehensive cruise-specific genotype series.[4] Cruise outbreaks may reflect broader community norovirus dynamics, because passengers and crew board from land-based populations. But the available strain evidence does not let the cruise record be reduced to a single genotype explanation.
A threshold becomes tangible on Queen Mary 2
The Queen Mary 2 outbreak in December 2024 gives scale to the VSP threshold. CDC’s public outbreak record for that voyage listed 346 ill passengers among 2,565 passengers, an attack rate of 13.5%, and 71 ill crew among 1,233 crew, an attack rate of 5.8%.[3] Those percentages are well above the 3% reporting trigger. They also make clear why the threshold exists: once illness reaches that level on a single voyage, the event is no longer a scattered set of clinic visits.
A case like that should not be used to characterize every cruise voyage. It is an outbreak that crossed a high-visibility reporting threshold, not a random sample of shipboard experience. Its value is more mechanical than dramatic. It shows what the surveillance system is designed to catch: concentrated illness affecting enough passengers or crew to require investigation, control measures, and public documentation.
Why the true case burden is higher than the public count
The public VSP outbreak count underestimates total gastrointestinal illness for several reasons, and not all of them are flaws. Some are design choices that make the system usable. A threshold-based public list reduces noise and focuses investigations on events with enough reported illness to require response. But the same design means the list cannot answer the broader question, “How many people got norovirus on cruise ships?”
- Below-threshold events are excluded from the public outbreak pages, even if passengers or crew were ill.
- Only ships and itineraries under VSP jurisdiction are included, leaving many international-only routes outside the dataset.
- The AGE case definition changed in 2011, which complicates direct comparisons across the full 2006–2019 baseline.
- Incidence rates in the CDC analysis are based on the last report submitted before arrival rather than final cumulative voyage totals, which likely underestimates cases that occurred late in the voyage.
- Etiologic confirmation is incomplete, so norovirus attribution is strongest for known-cause outbreaks, not for every gastrointestinal illness event.
That last pre-arrival reporting detail is easy to miss and consequential. If final voyage case counts are not reported into MIDRS, then illnesses developing after the last pre-arrival report may not be reflected in the incidence calculations.[1] The direction of bias is not mysterious: the surveillance rate is likely lower than the true cumulative illness rate for the voyage.
This is why the CDC record is best read as an instrument with known calibration limits. It is strong enough to show the pre-pandemic decline, the predominance of norovirus among known-cause cruise GI outbreaks, the recurring association with larger ships and longer voyages, and the post-COVID rise in reportable outbreaks. It is not strong enough to count every illness or to prove a single cause for the 2024–2025 reversal.
Operational research is starting from the same constraint
A 2025 Travel Medicine and Infectious Disease modeling paper on forecasting norovirus cases for onboard outbreak management points toward a practical use of these data streams: ship medical teams and public health staff need earlier estimates of where an outbreak may be heading, not just a final count after the voyage is over.[5] That kind of work does not remove the reporting limitations. It treats them as the conditions under which decisions are actually made.
There is a broader surveillance-methods conversation here, including how digital systems and analytic tools are changing outbreak detection; for adjacent context, see ClinicalMind’s discussion of AI in public health surveillance. But the cruise evidence does not need an artificial intelligence angle to be legible. The central issue is still the old surveillance problem: a useful dataset can be both revealing and incomplete.
What the CDC data can fairly support
The fairest reading is neither reassurance nor alarm. CDC VSP data show that acute gastroenteritis incidence on covered cruise ships declined markedly from 2006 through 2019, with norovirus responsible for approximately 90% of known-cause gastrointestinal outbreaks.[1] The same public surveillance record then shows a sharp post-COVID increase in reportable gastrointestinal outbreaks, reaching 16 in 2024 and a record 23 in 2025.[2][3]
Those numbers do not measure total norovirus illness at sea. They exclude below-threshold events, omit ships outside VSP jurisdiction, span a case-definition change, and rely on pre-arrival reports rather than final voyage totals. They do show that the post-pandemic outbreak pattern stopped behaving like the pre-pandemic trend line. That is enough to take the signal seriously, and not enough to make it say more than it can.
References
- Acute Gastroenteritis on Cruise Ships — Maritime Illness Database and Reporting System, United States, 2006–2019. CDC MMWR. 2021.
- Cruise Ship Outbreaks. CDC Vessel Sanitation Program.
- Earlier Cruise Ship Outbreaks. CDC Vessel Sanitation Program.
- Increasing Predominance of Norovirus GII.17 over GII.4 in US Outbreaks. PMC.
- Forecasting norovirus cases to support onboard outbreak management. Travel Medicine and Infectious Disease. 2025.
Comments
Join the discussion with an anonymous comment.