
In a Legionnaires' disease outbreak investigation, one of the early bottlenecks is painfully ordinary: someone has to find the cooling towers. Not in the abstract, and not eventually. Investigators need a workable list of nearby candidate towers while cases are still being interviewed, environmental sampling routes are being planned, and the source area may still be shifting.
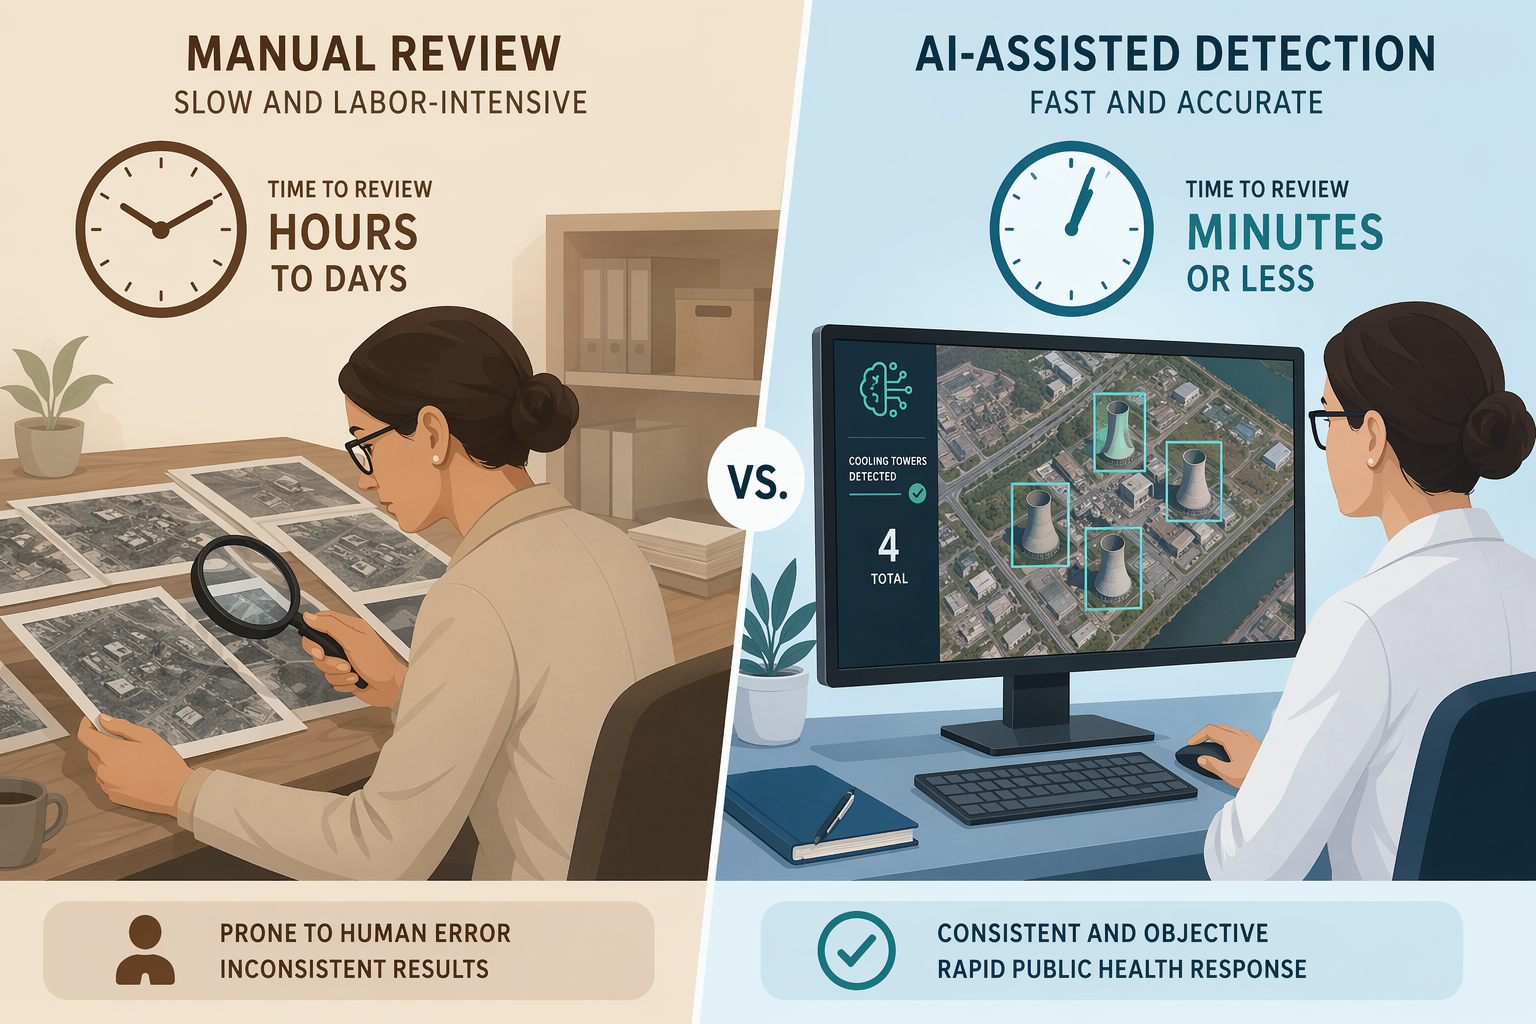
That is where TowerScout earns attention. In the peer-reviewed validation study, the model searched 45 city blocks, covering 0.26 square miles, in a mean of 7.6 seconds. Human reviewers took a mean of 83.75 minutes for the same task, making the automated search roughly 600 times faster for that comparison.[1] CDC later described the operational effect as about a 98% time reduction, from roughly 4 hours to about 5 minutes per investigator.[2]
The boundary matters as much as the speed. TowerScout does not detect Legionella. It does not diagnose Legionnaires' disease, prove that a tower emitted contaminated aerosol, or close an outbreak investigation. It detects likely cooling towers in aerial or satellite imagery so epidemiologists can move faster from a search problem to a field investigation problem.
That makes it one of the clearest examples of AI in Legionnaires' disease outbreak detection because it is not a broad surveillance promise. It is a specific tool aimed at a specific environmental-source task that public health teams already have to do.
What TowerScout Changes During an Active Investigation
Cooling towers are plausible sources in many Legionnaires' disease investigations because they can aerosolize water and distribute contaminated droplets beyond a single building. When a cluster appears, investigators may need to inspect a radius around patient locations, workplaces, health care facilities, hotels, or other exposure sites. Before automated detection, that often meant manually reviewing map tiles and aerial imagery, block by block.
Manual review is not intellectually hard in the way case classification or causal inference can be hard. It is worse in a different way: repetitive, time-consuming, and easy to slow down when the team is already stretched. A person must scan rooftops, distinguish cooling tower shapes from mechanical equipment, mark locations, and then hand those locations off to the next phase of the response.
TowerScout compresses that first pass. It gives investigators a candidate set of tower locations much sooner, which can change the tempo of route planning, environmental assessment, and coordination with building owners. The epidemiologic judgment still sits with the response team: which towers are plausible given the case distribution, which sites need sampling, what environmental results mean, and whether the evidence supports source attribution.
For readers looking at broader AI outbreak surveillance products, TowerScout sits in a narrower lane than general event-detection or signal-monitoring platforms. Those broader systems are useful to compare, but they are not substitutes for cooling-tower identification in a Legionnaires' disease field response. A wider overview of those platforms is available in Comparing AI-Powered Outbreak Detection Platforms.
The Validation Evidence Is Strongest Where It Is Most Specific
The main evidence base comes from the 2024 Lancet Digital Health validation study. TowerScout was trained on 2,051 images containing 7,292 annotated cooling towers. In trained cities, the test set included 548 images and 2,371 annotated cooling towers; the model reached 95.1% sensitivity, with a 95% confidence interval of 94.0% to 96.1%, and a positive predictive value of 90.1%.[1]
| Setting | What was measured | Reported performance |
|---|---|---|
| Trained cities | Cooling tower detection on 548 test images with 2,371 annotated towers | 95.1% sensitivity; 90.1% positive predictive value |
| Boston, unseen during training | Generalizability to a large untrained city | 91.6% sensitivity |
| Athens, GA, unseen during training | Generalizability to a smaller untrained city | 86.9% sensitivity |
| 45-block search task | Search speed across 0.26 square miles | 7.6 seconds for TowerScout vs 83.75 minutes for mean human review |
Those trained-city numbers are good enough to change practice, but they are not the whole story. In Boston, which was not used during training, sensitivity was 91.6%. In Athens, Georgia, another unseen city and a smaller one, sensitivity was 86.9%.[1] That drop is not a reason to dismiss the tool. It is a reason to use it with the same discipline investigators already apply to exposure histories, environmental maps, and sampling results.
Sensitivity here means the share of annotated cooling towers the model detected. Positive predictive value means the share of model-flagged detections that were true cooling towers in the validation set. Neither metric says a detected tower contains Legionella. Neither says a detected tower caused an outbreak. The result is a faster, better-organized list of places to consider, not a confirmed source list.
The Athens result is especially useful because it keeps the evidence honest. A model that performs well in cities resembling its training data may still miss towers where roof layouts, building density, imagery quality, or local architecture differ. In field terms, the missed tower is not a statistical footnote. It may be the site that still has to be found by a sanitarian, an epidemiologist, a facilities contact, or a second pass through imagery.
How the Two-Stage Model Fits the Work
TowerScout uses a two-stage computer vision workflow. First, a YOLOv5 object detection model searches aerial imagery for candidate cooling tower shapes. Then an EfficientNet-b5 classifier filters those candidates to decide which detections are likely true cooling towers.[1] The architecture is worth understanding because it mirrors the human task: scan broadly, then decide whether the object is actually a tower.
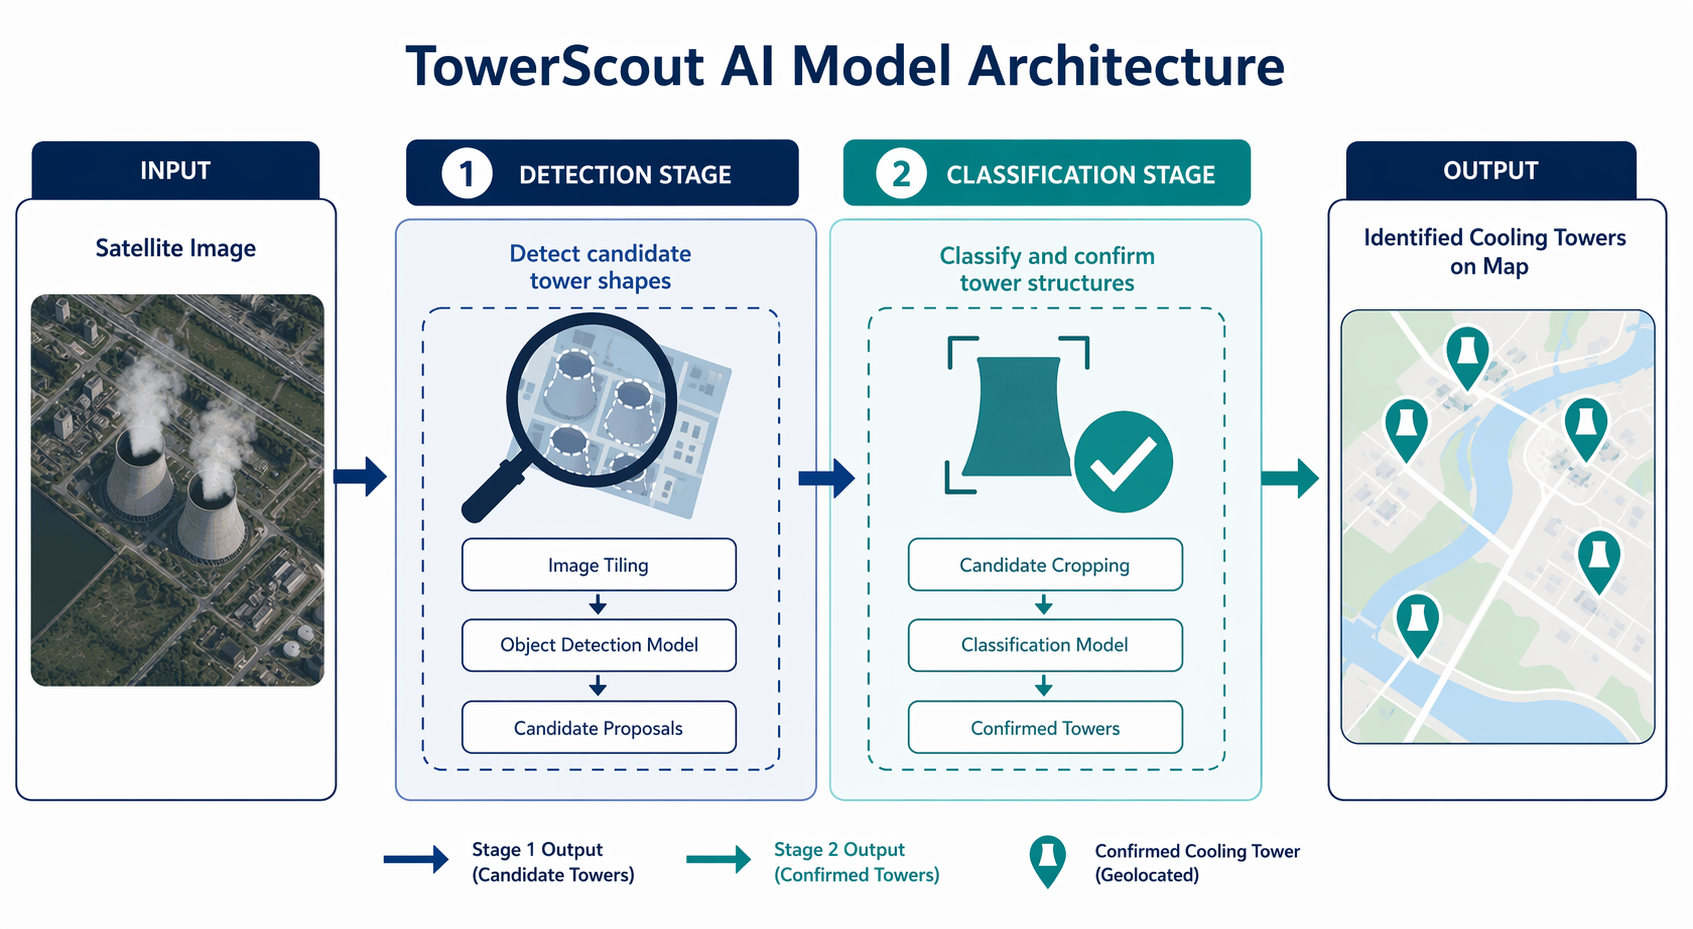
The first stage favors reach. It looks across imagery for objects that resemble cooling towers, which helps avoid relying on a person to notice every rooftop structure under time pressure. The second stage reduces noise by separating likely towers from other rooftop equipment. For an outbreak team, the practical output is not a neural-network explanation; it is a map or list that can be reviewed, prioritized, and combined with case geography.
This kind of tool is most useful when the next step is already operationally defined. If detected towers fall near a cluster's likely exposure area, investigators can decide which sites need outreach, access requests, inspection, or sampling. If the model misses a side-mounted tower or a covered tower, however, the workflow can still fail unless the team knows where the blind spots are.
Deployment Makes the Evidence More Relevant, Not Unlimited
TowerScout is not only a retrospective modeling exercise. The validation study reports use in 24 outbreak investigations across 12 US states between April 2021 and February 2024.[1] CDC's 2026 AI success story describes continued operational use and frames the time savings as a way to help investigators move more quickly toward environmental action.[2]
That deployment record matters because outbreak work is unforgiving about tools that only behave well in a paper. A system has to run while staff are coordinating interviews, communicating with local partners, dealing with incomplete exposure information, and preparing for public-facing decisions. A model that removes hours of image review can be valuable even if it does nothing glamorous.
The ONC/HHS AI use case also documents TowerScout as an open-source tool and describes implementation by Los Angeles County.[3] That is a meaningful signal for health departments that do not want a black-box vendor product standing between them and their own outbreak workflow. Open-source availability does not solve validation, staffing, or imagery-access issues by itself, but it lowers one barrier to evaluation and local adaptation.
The right interpretation is bounded: 24 investigations across 12 states show that TowerScout has moved into real response settings. They do not prove that it will perform equally well in every US city, every building type, or any non-US setting. The validation evidence and the deployment evidence point in the same direction, but neither removes the need for local caution.
Where Investigators Still Have to Be Careful
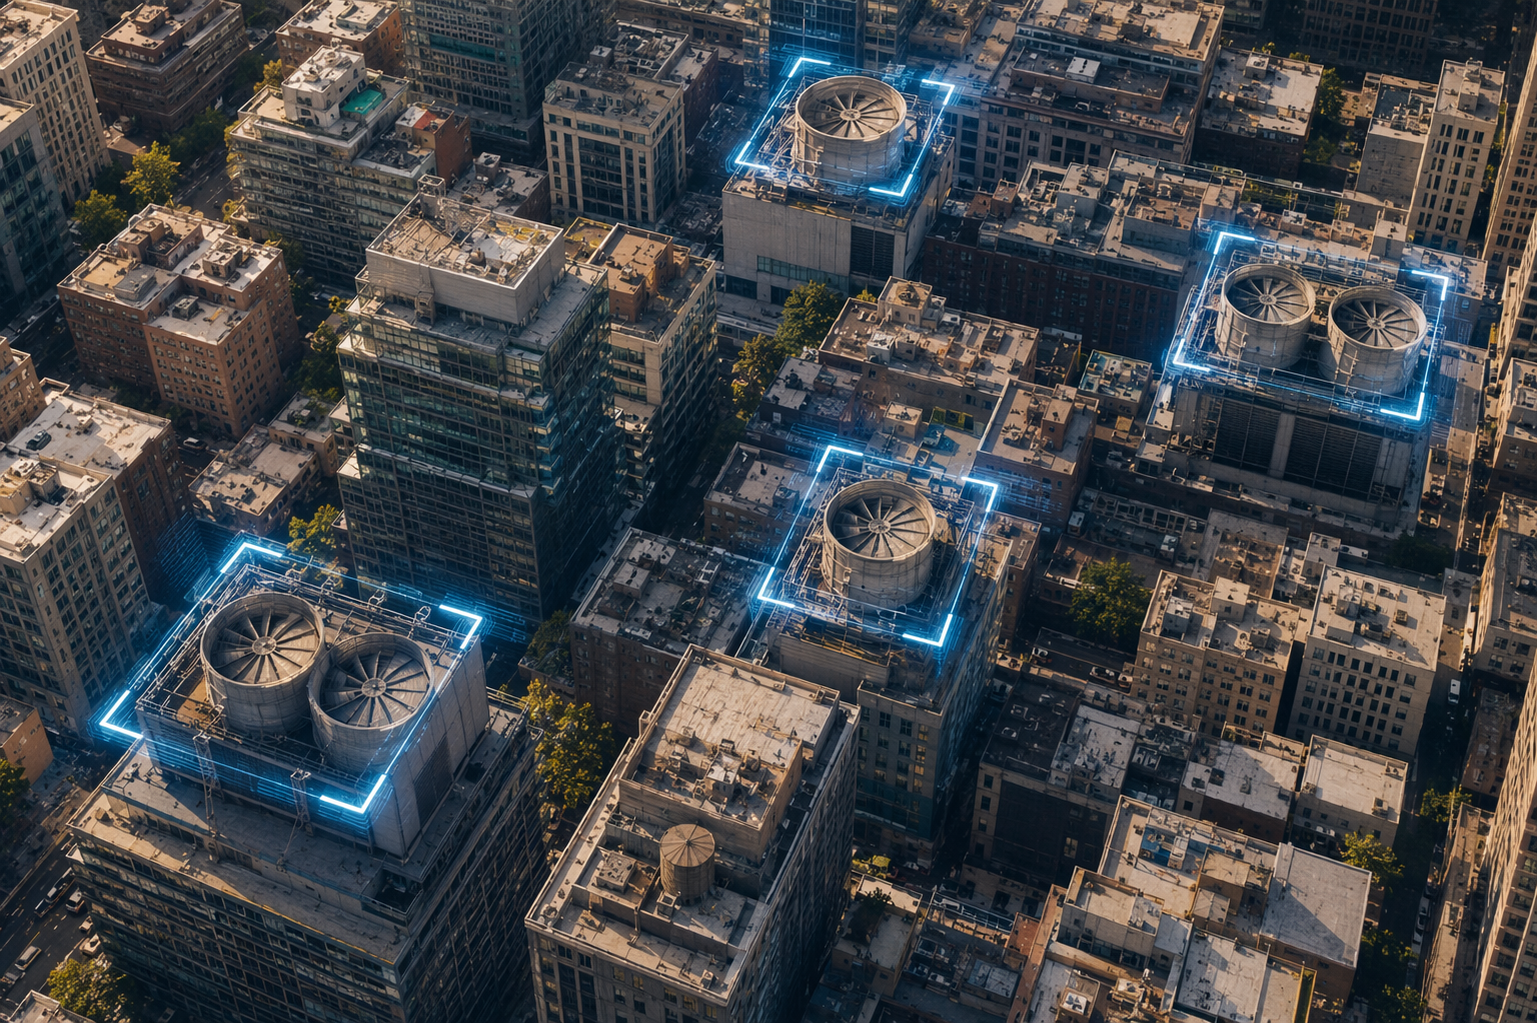
The clearest limitation is physical: TowerScout does not detect side-mounted or covered cooling towers.[1] That is not a minor edge case for the person in the field. A tower hidden by a wall, placed on the side of a building, or obscured from aerial view can still matter epidemiologically. If the model output is treated as exhaustive, those structures can disappear from the investigation too early.
Image conditions also matter. Lighting, shadows, rooftop clutter, and look-alike mechanical equipment can affect detection. These are familiar problems for human reviewers too, but automation can make them less visible unless the team deliberately reviews uncertainty. A clean output map can give a false sense of completeness when the underlying imagery is messy.
- Use TowerScout detections as candidate environmental sources, not confirmed outbreak sources.
- Plan a manual or field-based check for side-mounted, covered, or visually obscured towers.
- Treat performance in unseen cities as a local validation question, especially in smaller or architecturally different jurisdictions.
- Keep laboratory testing, environmental assessment, and epidemiologic linkage separate from tower detection.
- Document how model output changed the search area, sampling plan, or site-prioritization process.
The absence of international validation is another real boundary. The evidence in the research record is US-based. A city outside the United States may have different rooftop architecture, cooling infrastructure, imagery availability, regulatory records, and building-access pathways. TowerScout may still be useful there, but the published evidence does not establish that performance.
How This Compares With Broader AI for Legionnaires' Disease
Most discussion of AI in Legionnaires' disease quickly widens into general outbreak detection, clinical decision support, water-system monitoring, or predictive analytics. Those areas are worth watching, but the evidence is more heterogeneous. TowerScout stands out because it was built around a defined outbreak-response task, evaluated with transparent performance metrics, and used in actual investigations.
That does not make it a complete Legionnaires' disease AI system. It occupies one point in the response chain: source search. It does not replace case finding, exposure assessment, diagnostic testing, environmental microbiology, remediation decisions, or communication with affected communities. A broader discussion of where AI may or may not fit across the care and response cascade is covered in How AI Supports Legionnaires' Disease Care — From Outbreak Detection to Treatment Decisions.
The practical value is narrower and stronger: when a cooling-tower-focused investigation is underway, TowerScout can reduce the time spent finding plausible towers and give investigators more time for the parts of the work that still require judgment, access, sampling, and interpretation.
A Bounded Adoption Judgment
TowerScout is the most mature AI tool specifically for Legionnaires' disease source detection in the current evidence base. Its strongest claim is not that AI can transform public health in general. Its strongest claim is that a CDC-developed, peer-reviewed, operationally deployed computer vision model can make cooling tower identification much faster during an outbreak.
The case for wider use is credible for cooling-tower-focused investigations, especially in jurisdictions prepared to review model output rather than accept it as a source determination. The tool gives days back in a part of the investigation where speed matters. It still leaves the hard public health work where it belongs: with epidemiologists, environmental health staff, laboratorians, and local responders who have to decide what the evidence actually proves.
References
- Automated detection of cooling towers in satellite images for Legionnaires' disease outbreak investigations: a validation study — The Lancet Digital Health, 2024.
- AI's Role in Stopping Legionnaires' Disease — CDC, April 2026.
- TowerScout: Automated Cooling Tower Detection from Aerial Imagery for Legionnaires' Disease — HealthIT.gov.
Comments
Join the discussion with an anonymous comment.