
The least fit city rankings and health implications are most useful when they stop being a civic scoreboard and start acting like a diagnostic prompt. In the 2026 ACSM American Fitness Index, the bottom five cities are Oklahoma City, Memphis, Port St. Lucie, Indianapolis, and Lubbock, appearing at the low end of a 100-city assessment built from indicators across health behaviors, health outcomes, built environment, recreation access, and policy or funding conditions.[1]
That matters because a low ranking is rarely about one behavior. It is the visible end of many small constraints: a bus route that does not reach a clinic, a neighborhood without shade, a park that is too far from an older adult’s apartment, a recreation program priced for families with flexible schedules, a primary care panel where obesity and hypertension are already common before prevention resources arrive.

The national baseline is not reassuring. Only 23.7% of U.S. adults meet both the CDC aerobic guideline of 150 minutes per week of moderate activity and the strength-training guideline of two days per week.[1] Across the 100 largest U.S. cities included in the index reporting, more than 30% of residents report high blood pressure, and more than 30% report obesity.[1] Those figures are often quoted as awareness problems. They look different when placed next to sidewalk coverage, transit access, park distribution, air quality, and local prevention funding.
What “least fit” is actually measuring
The ACSM index is useful because it does not reduce urban fitness to gym attendance or personal discipline. Its 2026 methodology uses roughly three dozen indicators spanning individual behaviors, chronic disease outcomes, community assets, and policy conditions.[1] A city can therefore fall toward the bottom because residents report low physical activity, but also because the local environment makes routine movement inconvenient, unsafe, or unrealistic.
| Index dimension | Why it matters clinically |
|---|---|
| Health behaviors | Low physical activity and related behaviors shape obesity, diabetes, hypertension, and cardiovascular risk before those conditions appear in utilization data. |
| Health outcomes | High rates of obesity, high blood pressure, and chronic disease show where prevention has already lost time. |
| Built environment | Walkability, park access, transportation, and air quality affect whether physical activity is a realistic default or an added burden. |
| Recreation facilities | Facilities matter most when they are reachable, affordable, culturally usable, and distributed beyond already advantaged neighborhoods. |
| Policy and funding | Public investment determines whether prevention is sustained infrastructure or a short-cycle program. |
This is also why the ACSM ranking should not be casually mixed with other city lists. WalletHub and similar rankings may use different city samples and different weighting systems. A city’s position on one list is not interchangeable with its position on another, and treating them as equivalent can blur the very mechanisms the ACSM index is trying to expose.
For health systems, the danger is not that a city receives an unattractive rank. The danger is that the rank remains citywide. A single municipal score can conceal neighborhoods where cardiometabolic risk has been accumulating for years, especially in places where residents face overlapping barriers to movement, food access, primary care, and environmental safety.
The disease burden appears late
Cardiometabolic risk has a long fuse. Obesity trends can precede downstream cardiovascular events by an estimated 5 to 15 years, which means a city may see changing body-mass, blood pressure, and activity patterns long before strokes and heart attacks begin to shift hospital numbers.[2] By the time claims data shows the cost curve clearly, the built environment has already been assigning risk for a decade or more.
That lag is especially hard on public health teams and primary care networks. They inherit hypertension management, diabetes prevention, medication adherence, cardiac risk stratification, and follow-up after acute events. But many of the upstream conditions sit outside the clinic: distance, heat, street design, transit gaps, recreational access, exposure, stress, and neighborhood-level economic constraints.
Psychological distress is one mechanism worth keeping in view, though not one to import carelessly across settings. Luo and Wang’s 2022 study of 5,944 people in southeastern China found that psychological distress contributed 3.7 times more to type 2 diabetes risk than nutrition transition alone in the urban setting studied.[3] That does not provide a coefficient for Oklahoma City or Memphis. It does warn against treating diabetes risk as only a diet-and-exercise equation when urban stressors are part of the exposure.
The more practical question for U.S. population health is whether researchers and health IT teams can see these neighborhood risk patterns early enough to change resource allocation. If the answer is no, the index becomes another annual ranking. If the answer is yes, it becomes a map of where prevention is arriving too late.
Where AI starts to matter
AI is relevant here only if it improves the timing and geography of action. The most important use case is not a more impressive dashboard. It is the ability to link EHR, environmental, social, and neighborhood data so that cardiometabolic risk can be identified before a preventable event appears in the hospital record.
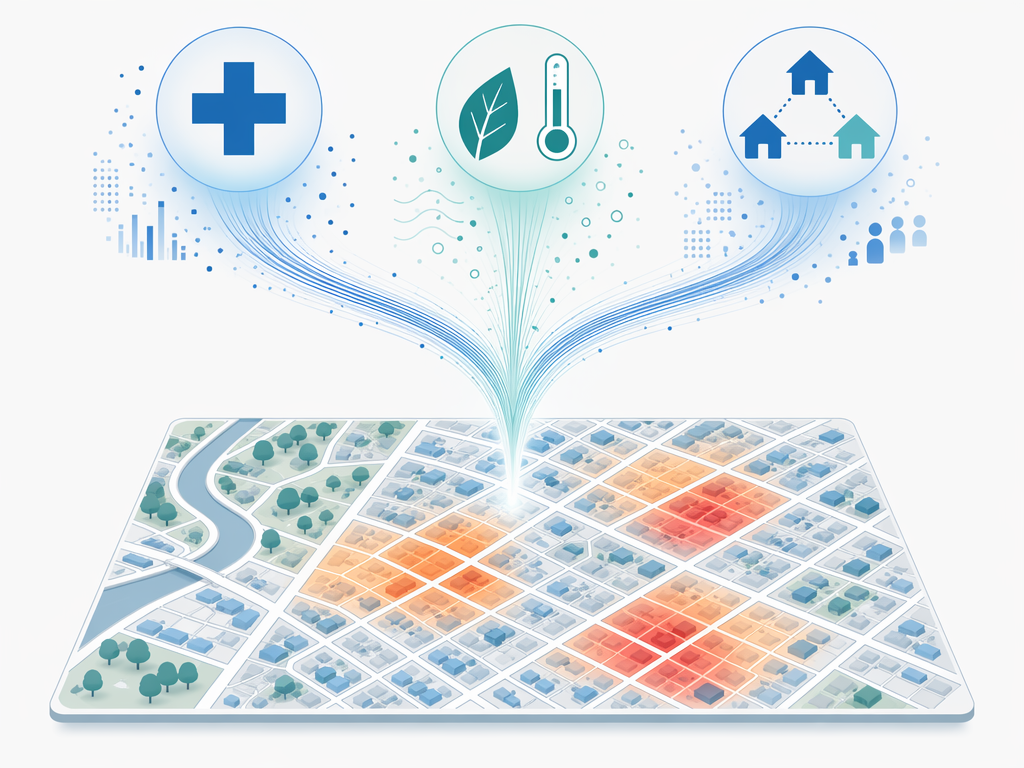
AI4HealthyCities is the clearest example in the current evidence base. Active in New York, Singapore, Basel, Helsinki, and Lisbon, the initiative uses linked EHR, environmental, and social data to identify neighborhood-level cardiometabolic risk. FP Analytics reported in January 2026 that the platform outperformed classic Framingham-style calculators without requiring clinical exams.[2]
That distinction matters. Traditional cardiovascular risk calculators are built for clinical prediction at the individual level. A neighborhood analytics platform is trying to answer a different operational question: where should a city, health system, or payer look earlier because the pattern of risk is emerging below the citywide average?
The same reporting describes street-level machine learning analysis across 100 U.S. cities linking physical features such as trees, grass, fences, and utility poles with neighborhood obesity prevalence.[2] The point is not that a tree directly prevents obesity. The point is that visible infrastructure can become measurable exposure data, especially when combined with clinical and social records.
For teams working on population health management, that kind of signal changes the unit of intervention. Instead of assigning risk only after a patient crosses a clinical threshold, a health system can ask whether specific neighborhoods show converging evidence of low activity opportunity, chronic disease burden, environmental exposure, and limited access. That is where links to tools such as AI clinical decision support in primary care become operational rather than abstract: the clinical model is only as useful as the upstream data it can act on.
Digital twins show adjacent capabilities, not a shortcut
Several city-scale digital twin projects show how urban data can move from description to simulation. Abu Dhabi’s PHI platform combines clinical, lifestyle, environmental, and genomic data; Seoul’s S-Map uses a 3D digital twin and S-DoT sensor network to simulate wind, dust, and heat-island effects; Barcelona’s vCity applies AI-driven simulations to 15-minute-city planning.[2]
Those examples are useful because they show the neighboring technical capacity: cities can model heat, air, mobility, access, and health-related exposures with more spatial precision than conventional reporting allows. They are not proof that a bottom-ranked U.S. city can simply buy a platform and erase chronic disease disparities. Data governance, interoperability, staffing, funding, procurement, and political trust decide whether the model becomes a prevention tool or another layer of analytic theater.
Bias is not a side issue. If EHR data underrepresents uninsured residents, if wearable data overrepresents affluent users, if street imagery is updated more often in commercially valuable areas, or if police and complaint data stand in for neighborhood need, the model can reproduce the same inequities it claims to locate. Health systems evaluating these tools need the same skepticism they would apply to algorithmic bias in ML medical diagnosis: missingness is not random, and neither is measurement.
Intervention evidence needs careful labeling
The strongest claim for AI-enabled neighborhood analytics is earlier targeting, not guaranteed population-level improvement. CARDIO4Cities is encouraging but should be read with the right evidentiary weight. Pioneering cities reported up to a 13% reduction in strokes and a 12% reduction in heart attacks through targeted population health interventions, but those figures are self-reported outcomes from pioneering cities, not controlled-trial evidence.[2]
That caveat does not make the results irrelevant. Public health often works with pragmatic evidence before randomized proof is available. But it does mean researchers should separate three claims that are too often collapsed into one: a platform can detect geographic risk; a city can convert that detection into targeted intervention; and the intervention can reduce cardiovascular events. The first claim is technical, the second is operational, and the third is outcomes evidence.
For bottom-ranked U.S. cities, the operational layer may be the hardest. Neighborhood risk maps are only useful if someone has authority to move resources. That could mean mobile blood-pressure screening near transit hubs, primary care outreach in census tracts with high obesity and low park access, heat-adapted walking programs, pharmacy-based hypertension follow-up, or targeted investment in safe routes to parks and clinics. None of those actions requires pretending that software builds sidewalks. They do require the data system to show where clinical risk and environmental constraint overlap.
Air quality is a useful example because it sits between environment and cardiometabolic risk rather than neatly inside either category. When models translate exposure into health risk estimates, as discussed in AI approaches to air quality and health risk, the result can help health systems decide where environmental burden should influence prevention strategy. The same logic applies to heat, walkability, and recreation access.
What health IT teams should take from the rankings
The bottom of the ACSM index points toward a population health approach that is still uncommon in many U.S. cities: combine citywide indicators with sub-city clinical, environmental, and social data; identify neighborhoods where risks are converging; route interventions before downstream cardiovascular utilization spikes; then measure whether outcomes change.
- Start with validated public health indicators rather than vendor-defined wellness scores.
- Link EHR data with environmental and social data only under governance rules that address consent, privacy, missingness, and community oversight.
- Audit whether model inputs systematically exclude residents with poor access to care, limited broadband, unstable housing, or low digital participation.
- Treat neighborhood risk prediction as a resource-allocation tool, not as a label attached to residents.
- Evaluate outcomes in clinical and public health terms: blood-pressure control, diabetes prevention engagement, cardiovascular events, avoided admissions, and access improvements.
This is where the rankings become more than an annual embarrassment. Oklahoma City, Memphis, Port St. Lucie, Indianapolis, and Lubbock are not useful because they can be named as the “least fit” places. They are useful because their low rankings force a closer look at the geography of preventable disease.
AI-driven neighborhood analytics may shorten the 5- to 15-year delay between obesity trends and downstream cardiovascular events, but only if the data infrastructure, governance, funding, and bias controls are strong enough to support action.[2] The health implication of the least fit city rankings is therefore disciplined and practical: city averages are too slow for cardiometabolic prevention, and the next useful metric is whether earlier, smaller-area intelligence changes where care and public investment go.
References
- 2026 ACSM American Fitness Index, ACSM.org, July 14, 2026.
- AI4HealthyCities, FP Analytics, January 2026.
- Psychological distress contributes to the risk of type 2 diabetes in urban settings, PMC, 2022.
Comments
Join the discussion with an anonymous comment.