
An AQI above 300 is a useful alarm and a poor clinical instrument. It tells a city that the air has crossed into a hazardous category, often shown in maroon on public dashboards. It does not tell a health department which neighborhoods will carry the next wave of symptoms, which schools should hear first, or whether an older adult with cardiovascular disease and a child with asthma should receive the same instruction as a healthy commuter.
That is the practical opening for AI interpreting air quality index hazardous levels for health. The strongest current work does not make AQI clinically personal in the way a validated risk calculator does. It does something narrower, and still useful: it classifies or forecasts hazardous air more accurately than older statistical approaches, then overlays population density and vulnerability factors to produce relative health risk strata. The distinction matters because a technically strong environmental model can still be a clinically unproven intervention.

From a maroon map to a risk-stratified signal
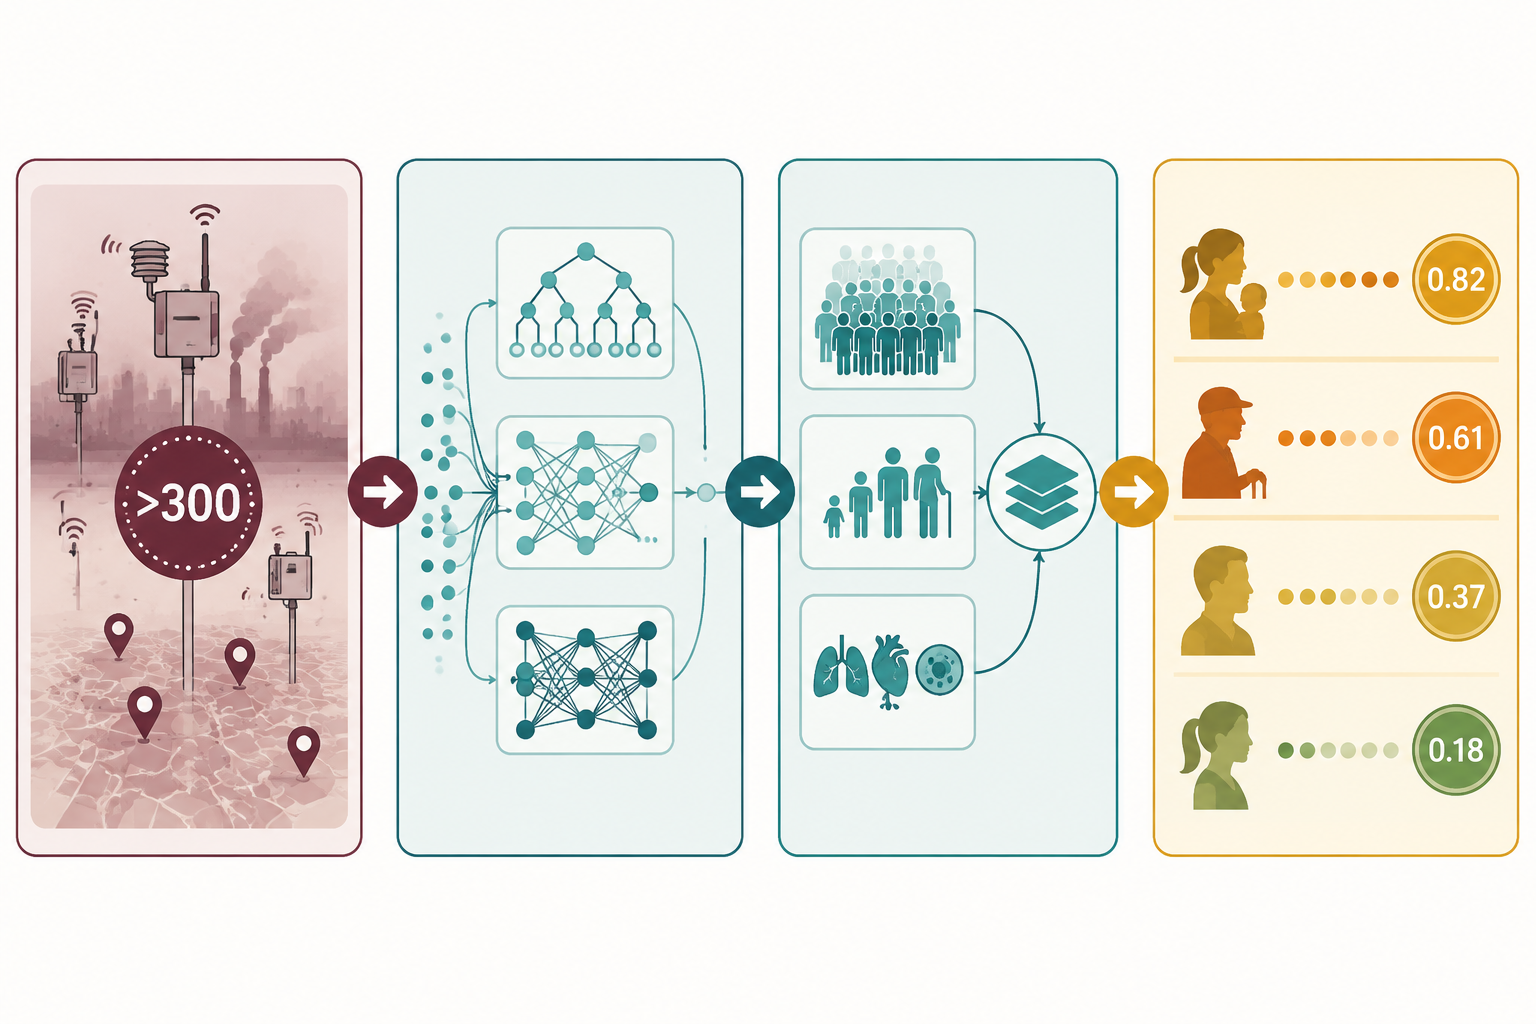
The basic workflow is easy to overstate, so it is worth describing plainly. Monitoring stations, satellite inputs, meteorological variables, traffic indicators, and pollutant concentrations enter a prediction model. Ensemble machine learning methods such as Random Forest and XGBoost, or sequential deep learning models such as LSTM-based architectures, classify the AQI category or forecast the next interval. A separate health risk layer then weights the output by population density and vulnerability indicators such as age distribution and prevalence of asthma, COPD, or cardiovascular disease.
| Layer | What it contributes | What it does not prove |
|---|---|---|
| AQI and pollutant inputs | Identifies hazardous environmental conditions and pollutant exceedances | Does not distinguish individual clinical susceptibility |
| AI classification or forecasting | Improves detection or prediction of severe air quality categories | Does not show that alerts improve health outcomes |
| Demographic and vulnerability weighting | Prioritizes subgroups and locations where exposure may carry higher relative burden | Does not create validated patient-level risk coefficients |
| Dashboard or alert output | Supports surveillance, targeting, and communication | Does not by itself qualify as clinical decision support |
This is where the field is most interesting. A hazardous AQI category is deliberately blunt; it is designed to communicate population danger quickly. A model that keeps the environmental warning intact while adding age, disease burden, density, and pollutant mix is not merely decorating a dashboard. It is changing the unit of attention from a whole city to smaller groups of people who may need different outreach.
That translation pipeline is also where the evidence needs careful separation. Model accuracy belongs to the air quality classification problem. Health risk scores belong to a second mapping problem. Clinical utility belongs to a third question: whether acting on those scores prevents exacerbations, admissions, or deaths. Current evidence is much stronger for the first question than for the third.
The classification evidence is technically strong
The performance signals are not trivial. A 2025 systematic review of 65 Q1 articles reported ensemble machine learning models, including Random Forest and XGBoost, reaching up to 98.2% accuracy for air pollution monitoring tasks.[1] That figure deserves attention because public health response during hazardous episodes depends on timely classification and local confidence, not just annual averages or retrospective exposure estimates.
Hybrid deep learning models add a different strength: sequence-aware classification. In a Scientific Reports study, a CNN-LSTM architecture achieved about a 91% F1-score for AQI classification, outperforming standalone CNN and LSTM models that reached 86.7% and 87.9%, respectively. The same study reported class-wise recall of 0.977 for the “Severe” category and 0.946 for the “Very Poor” category.[2] For hazardous-air operations, recall in the upper-risk categories matters because missed severe events are more consequential than misclassifying a mild day.
These results support a restrained claim: AI models can classify high-risk air quality states with substantial technical competence in the datasets studied. They do not show that a patient who receives an AI-generated warning uses medication differently, avoids exposure successfully, or avoids an emergency department visit. That bridge has not been crossed by classification accuracy alone.
For readers who want the broader evidence base behind these model classes, ClinicalMind’s companion review on AI for air quality monitoring and health impact prediction is the better place to compare algorithm families. The central issue here is narrower: what happens when those classifications are turned into health risk guidance.
How the Health Risk Index changes the question
The Health Risk Index framework described in recent AQI modeling work combines pollutant exceedance factors, population density, and vulnerability weights into a normalized 0–1 score. In that framework, AQI categories map to relative risk values: Good at 0.05, Satisfactory at 0.10, Moderate at 0.25, Poor at 0.50, Very Poor at 0.75, and Severe at 0.90.[2]
That mapping makes a dashboard more operational. A district with severe AQI, high population density, and a larger share of older adults or patients with cardiopulmonary disease can be flagged differently from a less dense district with the same AQI category. The output is no longer only “the city is maroon.” It becomes “these areas and cohorts should be prioritized first.”
The trap is to read 0.90 as if it were a calibrated clinical probability. It is not. In the cited framework, the score is a normalized relative indicator derived from advisory logic and vulnerability weighting. It is not an epidemiological coefficient validated against prospective admission rates, mortality, medication use, or symptom trajectories. A severe AQI score of 0.90 signals high relative concern inside the model’s framework; it does not mean a particular person has a 90% probability of a clinical event.
This distinction is not pedantic. It affects who should act and how. A relative HRI can justify public health triage: where to send outreach, which neighborhoods need more visible warnings, which clinics may want anticipatory messaging for asthma and COPD patients. It cannot yet justify individualized treatment changes as though it had been validated like a clinical risk prediction model.
ClinicalMind’s overview of how AI turns air quality data into health risk predictions follows this translation step in more detail. The important point for hazardous AQI is that the personalization is population-stratified before it is truly patient-specific.
Why interpretability matters during hazardous episodes
A risk-stratified dashboard is more credible when it can show why the model is worried. SHAP-based interpretability work has identified temperature, vehicle density, and relative humidity as influential features driving hazardous-level AQI predictions.[3] That kind of explanation is useful for public health teams because it connects a model output to conditions they recognize: heat, traffic intensity, moisture, stagnation, and pollutant accumulation.
Interpretability does not make a model clinically validated, but it can make it operationally safer. If a severe-risk flag is driven by pollutant exceedance plus local traffic density and weather patterns, officials can inspect whether the inputs are plausible. If the same flag appears because of a sensor artifact, missing data, or an unstable feature contribution, a human reviewer has a chance to catch it before the alert becomes public guidance.
This is especially important when wildfire smoke complicates the pollutant mix. PM2.5 from wildfire smoke may be about 10 times more toxic per unit than ambient PM2.5 from fossil-fuel sources. That does not automatically mean every wildfire-smoke model can quantify a 10-fold clinical risk at the patient level. It does mean that pollutant source, not just pollutant mass, is a modeling problem that simple AQI color bands do not fully solve.
For clinicians counseling patients during smoke events, this is where model output should remain a support rather than a script. Guidance on outdoor exercise during wildfire smoke still has to account for symptoms, baseline disease control, medication access, indoor air quality, and the feasibility of staying indoors.
Real-time dashboards are plausible; clinical deployment is not yet proven
Some proposed deployment frameworks update on 5-minute cycles using cloud-based dashboards and mobile alert systems.[2] That cadence fits the tempo of hazardous air episodes better than static daily summaries. A health department could use such a system to identify fast-changing hotspots, tailor messages for vulnerable groups, and coordinate with schools, elder-care facilities, or outpatient clinics.
The use case should be named carefully. Surveillance and targeted communication are reasonable near-term applications. Clinical decision support is a higher bar. Once a score is used to guide medication changes, triage decisions, remote monitoring intensity, or patient-specific restrictions, it needs evidence that the score improves decisions compared with existing practice and does not create avoidable harm.
The hospital-admission prediction literature points in a clinically relevant direction but remains too narrow to settle the question. Review evidence has described single-region models predicting respiratory admissions, including an ANN-MLP model in Balikesir, Turkey, with an R² of 0.99182, and LSTM approaches using pollutant markers such as PM2.5, PM10, O3, CO, NO2, and SO2 for cardiorespiratory admissions.[3] Those results suggest that air pollution signals can be statistically linked to utilization outcomes in specific settings. They do not establish that a generalizable, deployed AQI-to-risk-score system reduces admissions.
The common limitations are exactly the ones that matter at the bedside: single-city or single-region training, short-duration datasets of only a few months in some studies, inconsistent data quality, limited North American and European deployment evidence, and insufficient multi-season validation. A model trained during one pollution pattern may behave differently during another season, another wildfire plume, another traffic regime, or another sensor network.
That does not make the work unimportant. It means the next evidence layer has to be prospective. A useful study would predefine who receives the AI-stratified alert, what action is expected, what comparator is used, and which outcomes matter: symptom days, rescue medication use, clinic calls, emergency visits, admissions, or mortality. Without that design, a dashboard can look precise while leaving the clinical consequence unmeasured.
What action is justified now
The justified action is population-level and operational. Public health teams can use AI-enhanced AQI systems to sharpen situational awareness, prioritize communication, identify vulnerable neighborhoods, and decide where human review should focus first. Clinicians can treat these outputs as contextual risk signals when counseling patients who already have asthma, COPD, cardiovascular disease, pregnancy-related vulnerability, older age, or other reasons to avoid hazardous exposure.
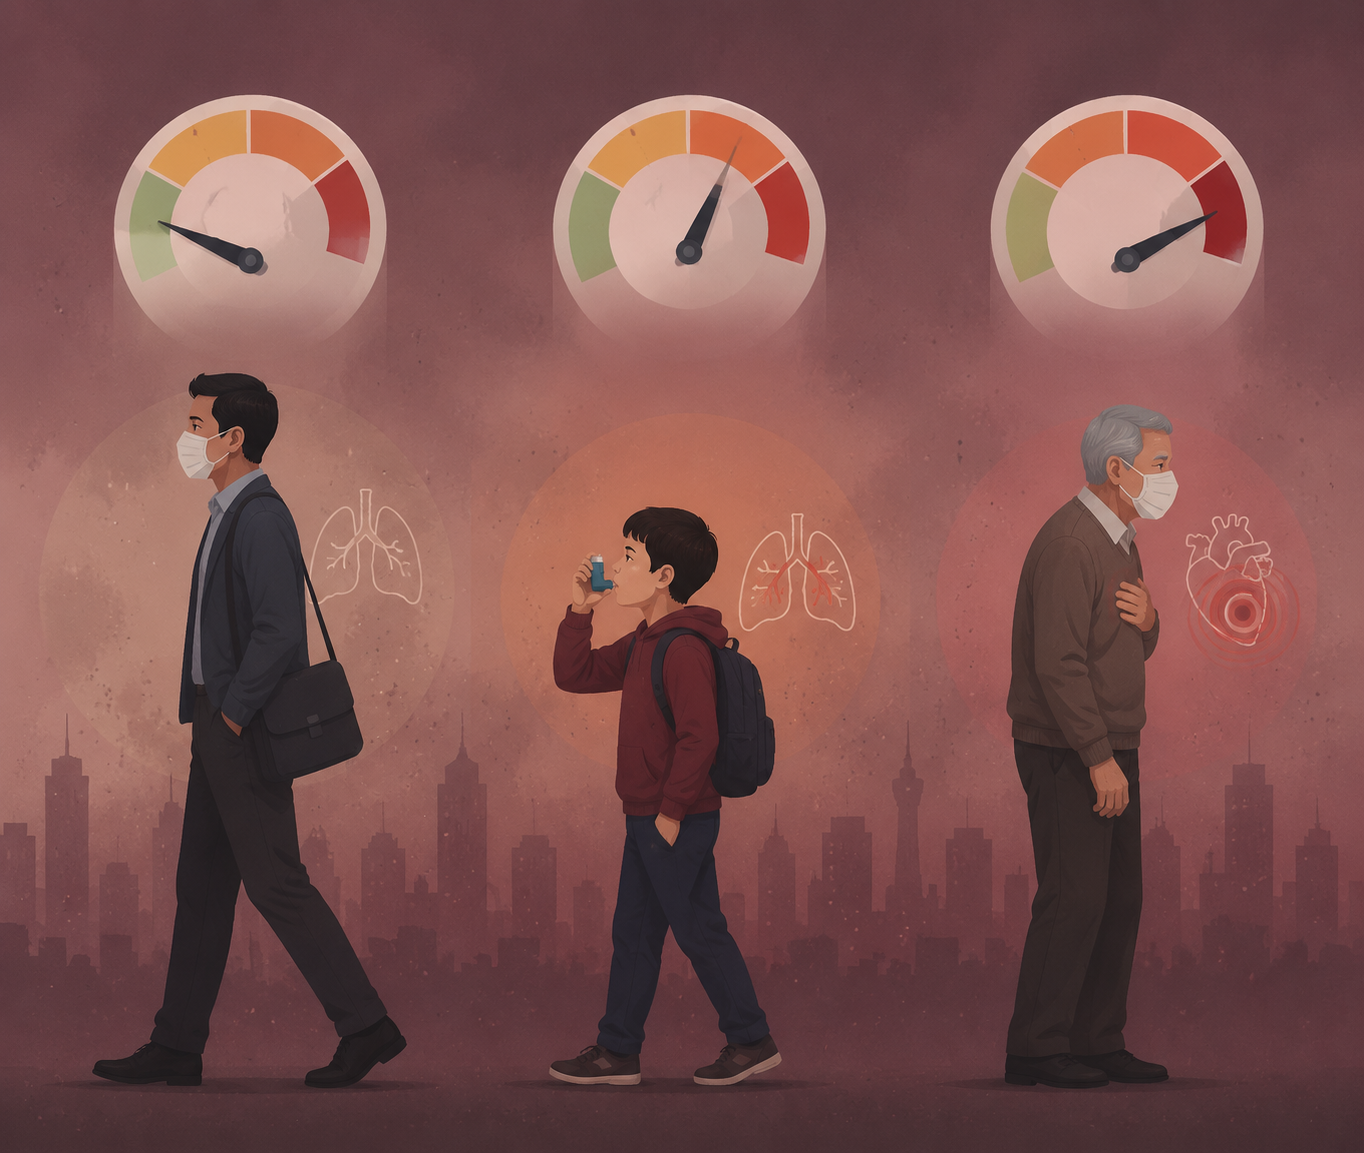
The unjustified leap is to treat a normalized score as a validated patient-level prognosis. A child with asthma in a severe AQI zone may need more urgent counseling than a healthy adult commuter, but the model has not yet proven the exact probability of an exacerbation or the exact benefit of a specific intervention. That remains a clinical and research question, not a solved dashboard feature.
This is also the boundary for personalization. AI can make advisories more specific than a citywide color code, and that is a meaningful advance. For the broader question of personalized air quality health advisories, the current evidence supports risk stratification more strongly than individualized clinical prediction.
The field has crossed an important technical threshold: hazardous AQI can be classified, forecast, interpreted, and mapped onto demographic vulnerability with impressive performance in research settings. It has not crossed the clinical validation threshold. Until prospective trials, multi-season external validation, and outcome studies show reductions in hospital utilization or improved patient outcomes, these systems are best understood as public health surveillance and communication tools, not clinical decision support.
References
- A systematic review of artificial intelligence and machine learning techniques for air pollution monitoring. ScienceDirect, 2025.
- Hybrid CNN-LSTM model for AQI classification and health risk assessment. Scientific Reports, 2026.
- Explainable AI for air quality prediction using SHAP-based interpretability. Environmental Sciences Europe, 2026.
Comments
Join the discussion with an anonymous comment.